
The price of CRV has been declining since late 2025, and the Curve DAO token is now pressing the lower limit of the descending channel that has defined the price action for several months. The $0.20 level is within reach, and the chart is setting up a clear binary outcome: hold and recover, or break into uncharted territory.
summary
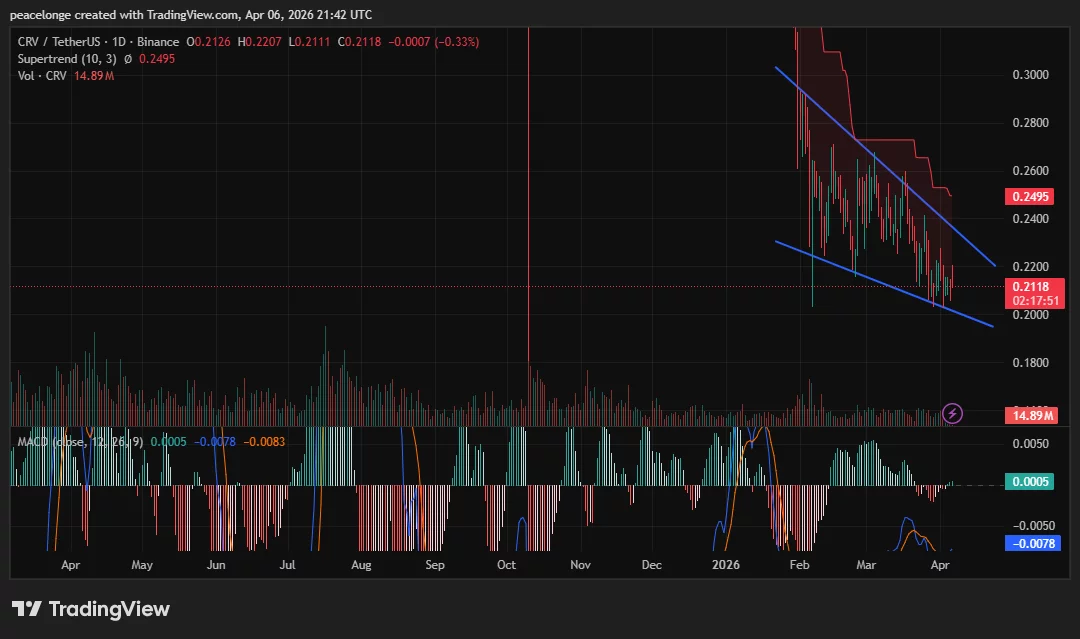
- CRV price reached $0.2118 on April 6, and is approaching the lower limit of a downward channel in place since late 2025, with the $0.20 psychological level as a key bearish reference.
- The daily supertrend at $0.2495 confirms the downtrend, although the MACD line at 0.0005 has marginally crossed the signal at -0.0078, which is a temporary early stabilization signal.
- A daily close below the channel minimum near $0.21 exposes $0.20, while a recovery above the supertrend at $0.2495 is required to shift the bias towards neutral.
DAO curve(CRV) The price is trading at $0.2118 on April 6, down 8.10% over the previous 24 hours, as the Curve DAO token continues to lose ground within a bearish channel that has defined its structure since late 2025. The token is pressing the lower limit of that channel, with $0.20 now the crucial downside reference for traders monitoring the largest decentralized exchange protocol in the DeFi sector.
On the daily chart, CRV has been contained within a bearish channel since late 2025, with the upper trend line aligned with the Supertrend at $0.2495 and acting as a rolling downside resistance. The lower limit of the channel is converging on price near $0.20, leaving a narrow range that typically precedes a more directional move. The daily MACD indicator shows that the MACD line at 0.0005 is crossing marginally above the signal at -0.0078, a temporary signal of early stabilization, although trading volume has not produced any spike that would confirm true accumulation beyond that reading.
On the 4-hour chart, a descending wedge pattern has formed between two converging trend lines, with the lower limit at Supertrend support at $0.2071 and the upper limit at $0.2224. The falling wedge is technically a bullish reversal pattern, although the MACD on the 4-hour chart at 0.0004 is essentially flat, providing no directional confirmation in this time frame.
Fast loan on March 2 exploited In the sDOLA-crvUSD Curve LlamaLend pool, which contained an inappropriate oracle configuration that temporarily distorted pool pricing, continue to… weight On market sentiment. Curve Finance confirmed that its underlying protocol contracts were not affected, but the incident left a residual risk premium in CRV pricing that has not yet been fully removed.
Key Levels: $0.2071 flat first, $0.20 below, $0.2495 up
The 4-hour supertrend at $0.2071 is immediate support. A four-hour close below this level exposes the $0.20 psychological level, which is in line with the lower bound of the expected daily channel. A daily close below $0.20 would represent a major breakout, with $0.18 the lowest level for the token since August 2024 according to TradingView. Datafor structural reference below. The $0.18 level is the extension target for the downside and the point at which the current thesis requires reassessment.
On the upside, the $0.2224 level is the upper limit of the falling wedge on the 4-hour chart and the first resistance to be cleared. The daily supertrend at $0.2495 is the key level to reclaim to challenge the broader downtrend. A confirmed daily close above $0.2495 would be the first reliable signal that the down channel is facing a real challenge.
Derivatives data confirms cautious positioning
According to CoinGlass data, CRV futures open interest fell 11.47% to $74.45 million as of late March, while an OI-weighted funding rate of 0.0067% indicates marginally net long positions despite lower prices. One of the market analysts indicated in an analysis dated March 30 that the current stage reflects “accumulation, not decline,” but He added A confirmed bullish reversal will only occur upon a return towards the $0.30 to $0.32 range. This remains a significant distance from the current price, and the technical structure has not yet provided the confirmation that this view requires.
If $0.2071 makes way on the 4-hour chart, a test of $0.20 looks likely. A close above $0.2495 daily would be the first real sign of a challenge to the downward channel structure.


