

XRP price has now rejected downtrend line resistance at least three times since late March, with the most recent failure on April 6-7 amounting to rising volume, a signal analysts associate with bearish continuation rather than consolidation.
summary
- XRP price reached $1.3184 on April 7 after being rejected at the downtrend line near $1.35 for the third time since late March, with the one-hour supertrend at $1.3247 acting as immediate resistance above the current price.
- The hourly MACD line is at -0.0046 with the signal at -0.0059 and a barely positive histogram at 0.0013, with both lines in negative territory confirming the absence of upward momentum despite the marginal rise.
- A break below the $1.30 to $1.28 support zone exposes the 23.6% Fibonacci retracement levels at $1.28, below which stand support falls towards $1.15, while a confirmed daily close above $1.35 is required to shift the near-term bias.
ripple (XRP) The price is trading at $1.3184 on April 7, down 1.9% from the session high after failing to close above downtrend line resistance near $1.35 on April 6. Rejection appears on the hourly chart as a red arrow indicating where the price touched the diagonal trend line and reversed, the third such failure since late March with the previous rejection marked at lower trend line contacts. The 1 hour supertrend at $1.3247 now sits just above the current price, providing an additional near-term ceiling that exacerbates the trendline rejection signal.
On the 1-hour chart, XRP is trading within a structure defined by a descending trend line that has produced at least three confirmed rejections since March 21, visible as orange circles at previous high points where the price touched and reversed from diagonal resistance. The red arrow indicates the most recent rejection, and is more significant because it came after the recovery from the $1.27 area briefly raised expectations of a breakout attempt.
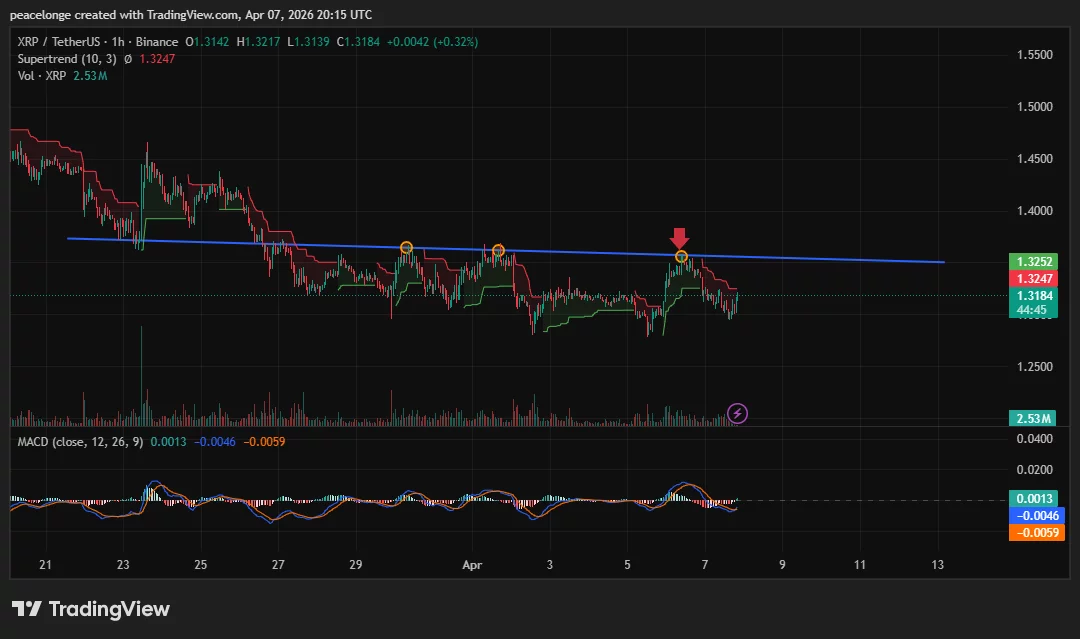
The 1-hour MACD line is at -0.0046, with the signal at -0.0059 and the chart reading 0.0013. Although the MACD line is slightly above the signal, both lines remain in negative territory and the 0.0013 chart reading is too small to form a meaningful bullish crossover. per Market data The daily RSI was published on April 7, where it stands at 38, and is described as “weak momentum, but not yet in oversold territory,” meaning there is no technical floor from this indicator alone. Same analysis male That open interest rises alongside falling prices is a sign that traders are adding short positions rather than accumulating, which tends to amplify downward moves if support declines.
Key Levels: $1.28 Fibonacci and $1.15 Bear Target
The $1.30 to $1.31 area is immediate structural support. A closing break below this level targets the $1.28 level, which has been holding since February and matches the 23.6% Fibonacci retracement of the previous XRP rally. Below $1.28, bear support is tapering off meaningfully towards $1.15 as the next important structural level. On the upside, a confirmed daily close above the downtrend line at $1.35 is the minimum required for a near-term bias change, and it would also need to clear the 50-day EMA at $1.38 to open a path towards $1.40 to $1.45. The Clarity Act, which the Senate targeted in late April, is a bilateral incentive capable of achieving this Converts Structural image if passed, but failure extends the current setting to a lower level.
Financial derivatives and ETF flow context
Spot XRP ETFs recorded $3.56 million in net outflows in the week ending April 6 per CoinMarketCap The data reflects a decline in demand at the point where new capital is needed to challenge trend line resistance. The combination of ETF outflows, rising futures open interest consistent with short positions, and decreasing order book depth on Binance leaves XRP vulnerable to larger moves once either level is broken.
If the daily closing price remains at $1.30, the range between $1.28 and $1.35 remains the decision zone. A close below $1.28 targets $1.15 as the next important support.


