


TLDR
- XRP rose after breaking above the downtrend line on the hourly chart.
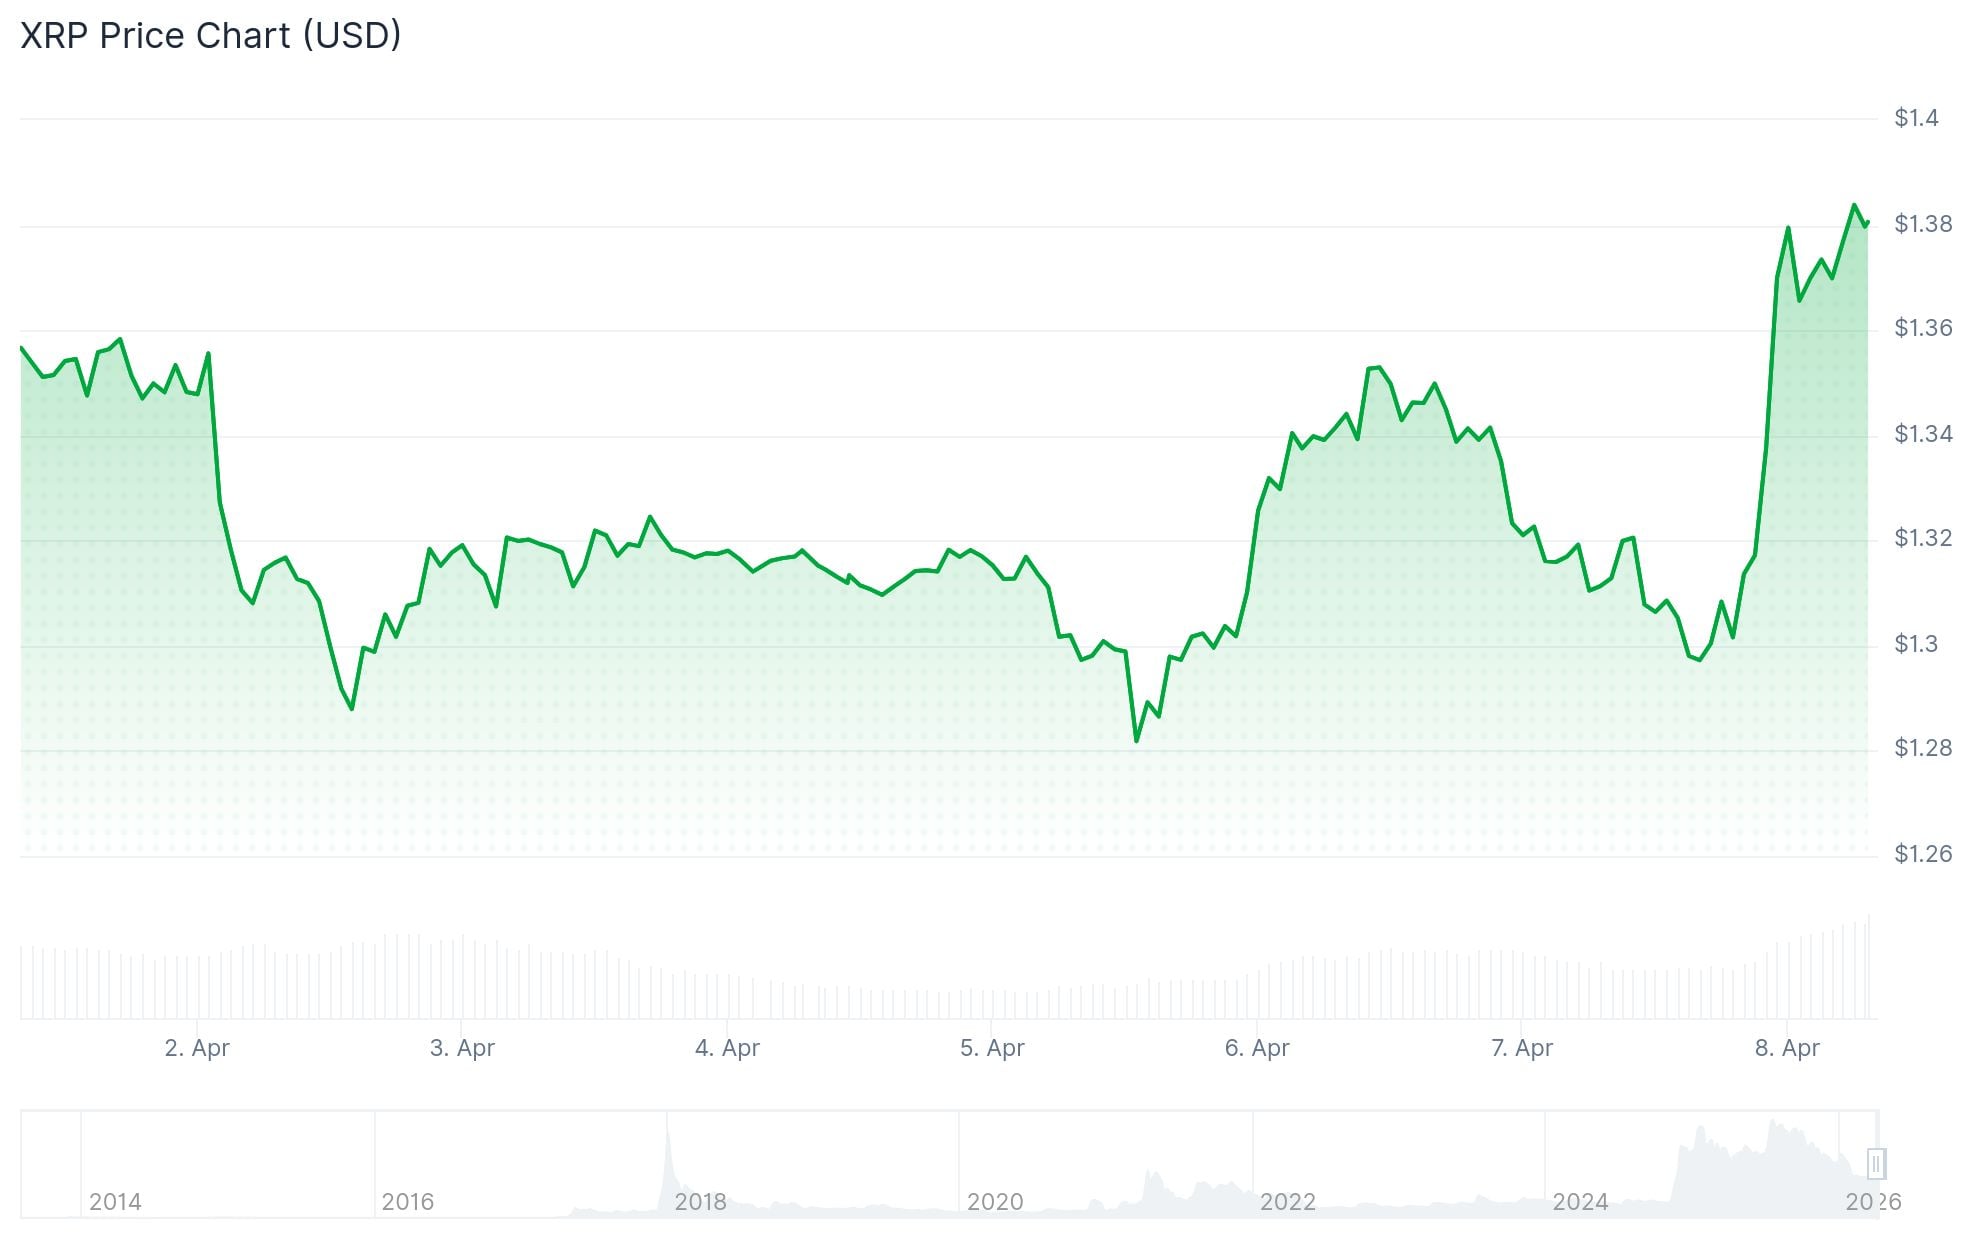
- The price reached $1.3963 before a small pullback and is still trading above the 100 hour moving average.
- The $1.3880 to $1.40 area is the key bullish area that traders are watching.
- Support is near $1.3575 and $1.3330 if the rally loses steam.
- Other market data showed ETF inflows and regulatory progress, but short-term signals remained mixed.
XRP (XRP) moved higher and approached the $1.40 level after a new intraday high. The token was trading near $1.38 after hitting a session high of $1.3963.
The move started after XRP rose above the $1.350 and $1.3550 levels. Buyers then pushed the price through the $1.3650 resistance area.
On the hourly chart, XRP also broke through the downtrend line with resistance near $1.3350. This breakout helped support the recent upward move.
📈 Only XRP is attracting funds now
BTC, ETH, and SOL ETFs all saw outflows, losing $159 million, $64.7 million, and $15.4 million, respectively.
XRP stood alone with a net inflow of $3.32 million. pic.twitter.com/ofnzmKD74p
— Currency Bureau (@coinbureau) April 8, 2026
After touching $1.3963, XRP fell slightly. However, the price remained above the $1.3550 level and above the 100 hourly simple moving average.
This keeps attention on the next resistance area. Traders are now watching whether XRP can cross $1.3880 and then $1.40.
The resistance area remains in focus
If XRP crosses the $1.40 level, the next upside levels will be seen near $1.4250 and $1.4450. Moreover, there is another hurdle near $1.4650.

short term, $XRP He has 3 walls selling up to $1.6.
The $1.34 level is the support line. pic.twitter.com/eE8yKroUSP
– CW (@CW8900) April 8, 2026
The short-term chart levels show that buyers are still in control of the price at the moment. The pair stabilizes above the main moving average after the recent rise.
Another market update said that XRP rose 5.63% on the day to trade near $1.3848. This report placed XRP above the 20-day moving average, but still below the 50-day and 200-day moving averages.
The same data showed the Ichimoku Kijun indicator approaching $1.4429. This level stands above the market and adds to the upper resistance area.
Support levels remain important
If XRP fails to break through the $1.3880 resistance area, the price may fall again. The first support is located near $1.3575.
Below that, the next major support is near $1.3330. This level also corresponds to the 61.8% Fibonacci retracement level of the move from $1.2940 to $1.3963.
A break below $1.3330 could expose $1.3080 and $1.3020. The next major floor below those levels is near $1.2750.
Another report said XRP It traded in a narrow range between $1.37 and $1.39, even with stronger institutional flows data. It also said that US XRP ETFs have taken in more than $1 billion since their launch, including $224 million in the last week.
The same report said momentum indicators were mixed, with the RSI leaning to the upside but the Stoch RSI showing overbought conditions. Analyst Anton Kharitonov said he remains defensive until XRP clearly surpasses the $1.39 level.
Boom! 🚨🚨🚨 $XRP It leaves the circle of resistance after the two-week ceasefire and the complete reopening of the Strait of Hormuz!
This is just the beginning!
Are you ready for two-week green candles?
LFG! https://t.co/LJ2Yt5p80y pic.twitter.com/2UEBvAEAbD
– Xfinancebull (@Xfinancebull) April 7, 2026
Finance Bull said XRP broke out following the two-week ceasefire and reopening of the Strait of Hormuz, and suggested this could lead to a two-week green candle. It was a strongly bullish post, but did not include chart-based levels or measured targets beyond this view.
For now, the last physical level remains clear: XRP is pressing against the $1.3880 resistance zone to $1.40 after rising from $1.2940.


