

Cardano’s ADA is showing renewed technical weakness, but the chart does not yet support the panic selling outcome.
ADA hints at a sell-off due to the triangle pattern
On the daily time frame, ADA has formed a symmetrical triangle after consolidating between $0.25 and $0.29 roughly for several weeks. These patterns usually appear before volatility expands. Since ADA entered the structure after a long decline from above $0.80, the setup is leaning towards the downside unless the bulls force a breakout above the resistance.
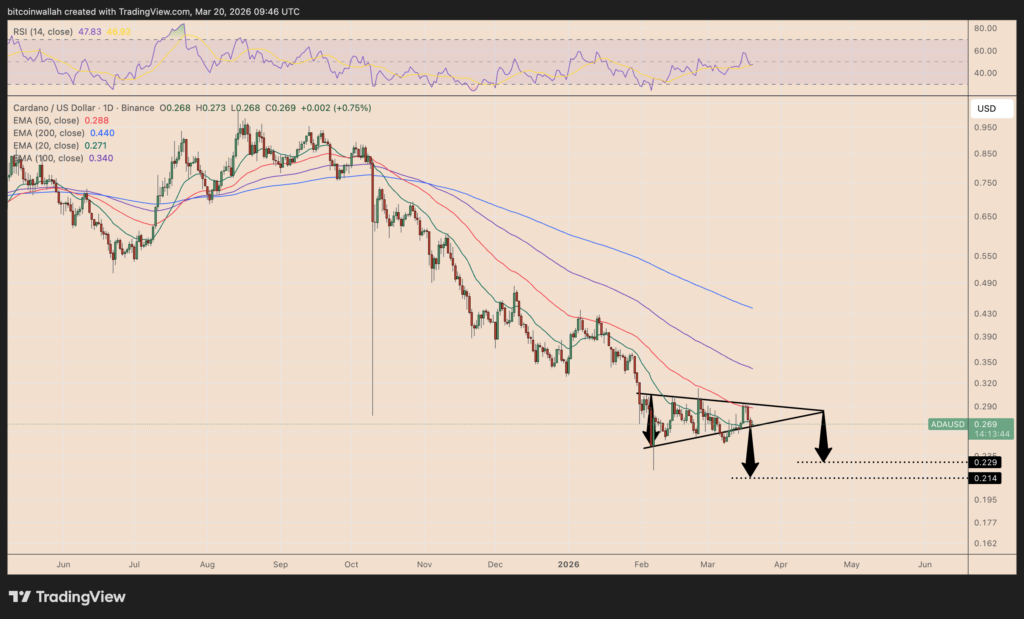
The key level to watch is the lower limit of the triangle near $0.255-$0.26. A decisive daily close below that area would confirm a breakout and increase the likelihood of a move towards $0.229 first, followed by a deeper decline to around $0.214 based on the measured target of the pattern.
The broader trend also remains weak. ADA remains trading below the 20-day, 50-day, 100-day and 200-day EMAs, a sign that sellers continue to dominate across the higher time frames. At the same time, the RSI is hovering near 47, which means momentum is neutral and leaves room for one more downward move before ADA becomes technically oversold.
However, this is not an automatic “sell asap” signal. The bearish case only remains valid while ADA remains confined below $0.29 and within a broader downtrend. A break above this level, especially if accompanied by a move back above the key moving averages, would weaken the breakdown setup and improve the odds of a larger recovery.
For now, the ADA chart suggests caution, not surrender.


