

Ethereum is trading at $2,255.04 in April 2026, up 7.09% on the monthly chart, after the monthly low at $2,017.09 was tested and held with an upward support trend line connecting key Ethereum lows since 2019. The MACD monthly chart has turned positive at 129.89, marking the first constructive macro momentum signal since late 2025 from decline. Peak $4800.
summary
- Ethereum price reached $2,255.04 in April 2026, rising 7.09% on the monthly chart, after testing the monthly low of $2,017.09 the ascending support trend line visible on the OKX monthly chart since 2019.
- The monthly MACD (12,26,9) chart reads positive at 129.89, with the MACD line at -29.45 trading above the signal at -159.35, confirming improved overall momentum when testing the trend line.
- The current bullish case targets the 50 SMA at $2,440.86; The monthly close below $2,017 breaks the trend line and exposes $1,500 as the next structural reference.
Ethereum (Ethereum) Price at $2,255.04 in April 2026, up 7.09% from the monthly close, after the monthly low of $2,017.09 was tested and maintained the ascending support trend line shown on the chart connecting Ethereum lows from the 2019 base during the current session. Both SMAs remain overhead: the 50 SMA at $2,440.86 is the nearest resistance and the 20 SMA at $2,857.71 is higher. The April monthly candle prints a long lower wick at the trend line, a candlestick structure that historically indicates demand absorption at a structurally important level.
The rising support trend line on the monthly chart connects Ethereum’s 2019 bear market lows, the 2020 pre-rally base, and the 2022 cycle bottom, making this the deepest and most tested structural level in Ethereum price history. The $2,017.09 monthly wick is the most important test of this trend line in the current correction, and it has held without a monthly close below it. The price has since rebounded to the $2,255 area, forming a positive monthly body above the trend line.
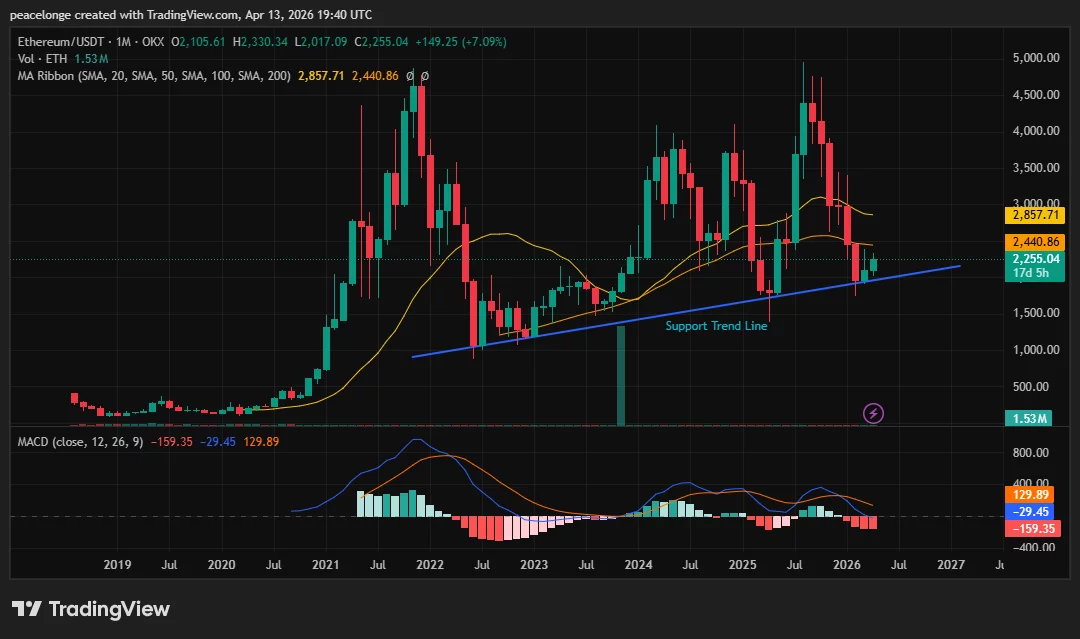
The monthly MACD (12,26,9) provides a critical secondary signal. The MACD line at -29.45 is now 129.89 pips above the signal at -159.35, producing a positive histogram. While both lines remain in negative territory, indicating that the overall trend has not reversed, a chart that turns positive when testing a multi-year trend line corresponds to momentum taking effect before the price does on the longer time frame. This is the first positive monthly chart reading since Ethereum’s decline accelerated from its August 2025 high near $4,800.
Cryptocurrency analyst Leshka wrote on
Key levels: support, resistance and price targets
The multi-year upward trend line, which currently intersects around $2,000 to $2,100, is the structural floor on a monthly closing basis. The monthly low of $2017.09 is the concrete level to hold: the monthly close below it breaks the trend line and exposes $1,500, which is in line with the 2023 accumulation zone and represents the last major demand zone before the untested zone.
On the upside, the 50 SMA at $2,440.86 is an immediate recovery target. A monthly close above it turns the SMA bar completely bearish and begins to regain the moving average structure. The 20 SMA at $2857.71 is the extension target and represents a return towards where both SMAs converged before the 2025 crash.
Invalidation: Monthly close less than $2,017.
Market data context and chain
Perpetual futures contracts on Ethereum Show Slightly positive funding ratio as of April 12, indicating a return to measured and sustained long-term demand. Ethereum Foundation Bet 45,000 ETH on April 5, approaching the target of 70,000 ETH, reducing spot trading selling pressure while generating an estimated return of $3.9 to $5.4 million annually. Whales withdrew more than 120,000 ETH from centralized exchanges in early March, the largest outflow since October 2025, according to CryptoQuant contributor Arab Chain, a pattern consistent with accumulation near structural support.
The pipeline upgrade provides a front-end catalyst
Glamsterdam upgrade to ethereum, The decision For the first half of 2026, it targets a significant increase in the gas limit, implementation of parallel transactions, and separation of offeror and originator. The upgrade continues the scalability work initiated by Fusaka’s hard fork, and is expected to meaningfully reduce layer 2 transaction costs, strengthening the base case for ETH at current prices.
If Ethereum holds the multi-year trend line on a monthly close basis and the MACD histogram continues to expand, the SMA 50 at $2,440 is the first recovery target, with the SMA 20 at $2,857 as an extended bull case. A monthly close below the $2017 level breaks the trend line and turns the overall structure to the downside.


