
Zebec Network’s ZBCN token risks a deeper correction after rising nearly 170% in the past two months.
Technical setup raises risk of ZBCN price drop by 50%
ZBCN/USDT has been trading around $0.0032 this week, down nearly 20% from last week’s local high near the $0.004 area. The pullback appeared after the symbol tested the upper trend line of a multi-month down channel pattern on the weekly chart, a setup that often precedes renewed downward moves when resistance holds.
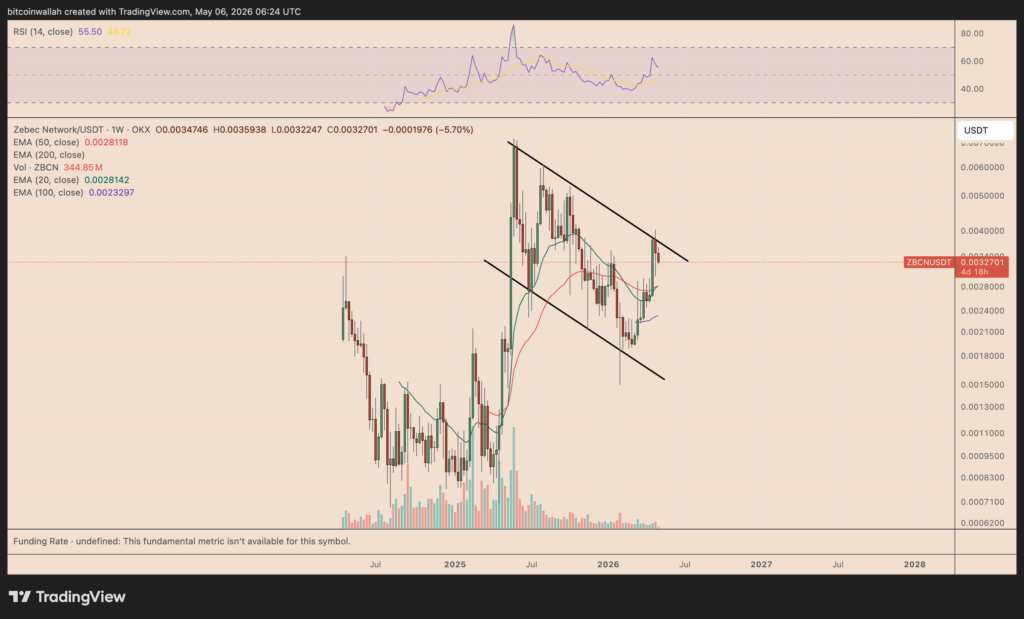
From a technical perspective, the coin now risks extending its decline towards its major EMAs first, including the 20-week and 50-week EMAs. These levels may provide temporary support during the ongoing correction phase.
However, a broader bearish setup indicates a larger downside target near the lower trend line of the channel. This support area corresponds to the $0.0014 – $0.0016 range, approximately 50% down from current price levels.
Bearish channels form when price trends fall between parallel resistance and support trend lines. Traders usually view the upper trend line as a selling zone and the lower trend line as a potential downside target during corrections.
The current structure of ZBCN suggests that the token could continue to decline in June or July if bearish pressure continues across the broader cryptocurrency market.
What if the Zebec bearish grid misses?
Bulls hold the chance to invalidate the bearish setup.
A decisive break above the channel upper resistance area near $0.0034 to $0.0036 could weaken the bearish outlook.
Such a move could lead to a new high towards $0.0045, which coincides with the 0.382 Fibonacci retracement level on the weekly chart. The weekly Relative Strength Index (RSI) for ZBCN supports the bullish case, with room to rise further as it moves below the overbought threshold of 70.
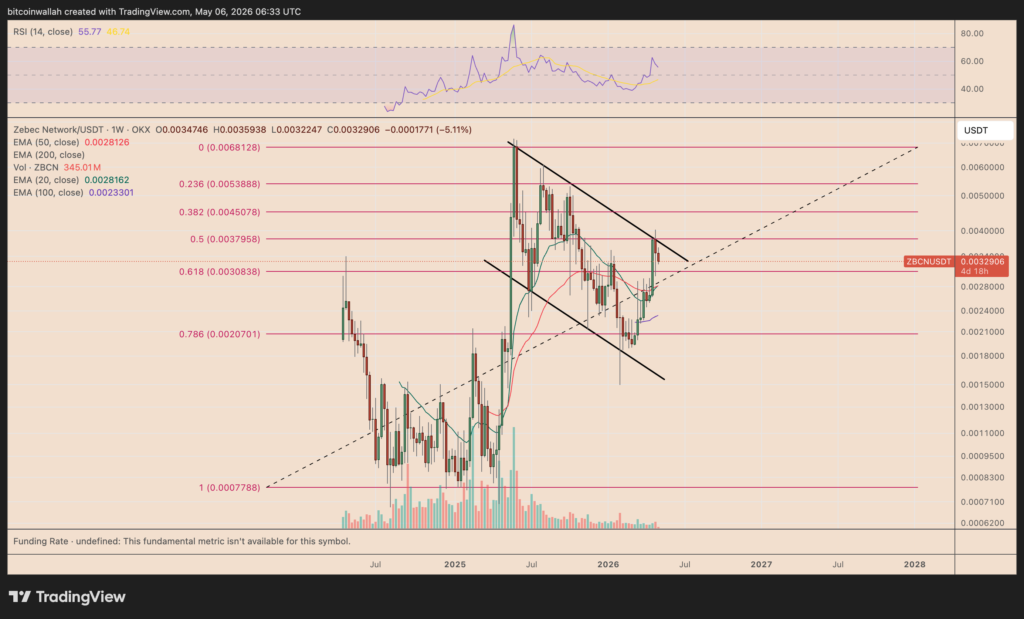
Until then, traders appear to remain cautious as ZBCN struggles to maintain momentum above channel resistance.
For more Bitcoin, cryptocurrency and macro news, read on www.coinchapter.com.