

Hedera’s HBAR token may be entering the early stages of another major bullish expansion, according to new higher time frame analysis from market analyst CRYPFLOW, who previously touted an 825% HBAR rally.
HBAR price could double in 2026
CRYPTOFLOW says HBAR is now repeating the same broader cycle structure that preceded its last explosive hack. The setup resembles the classic falling wedge pattern, which is a bullish reversal structure that forms when the price squeezes within converging, downward-sloping trend lines before breaking higher.
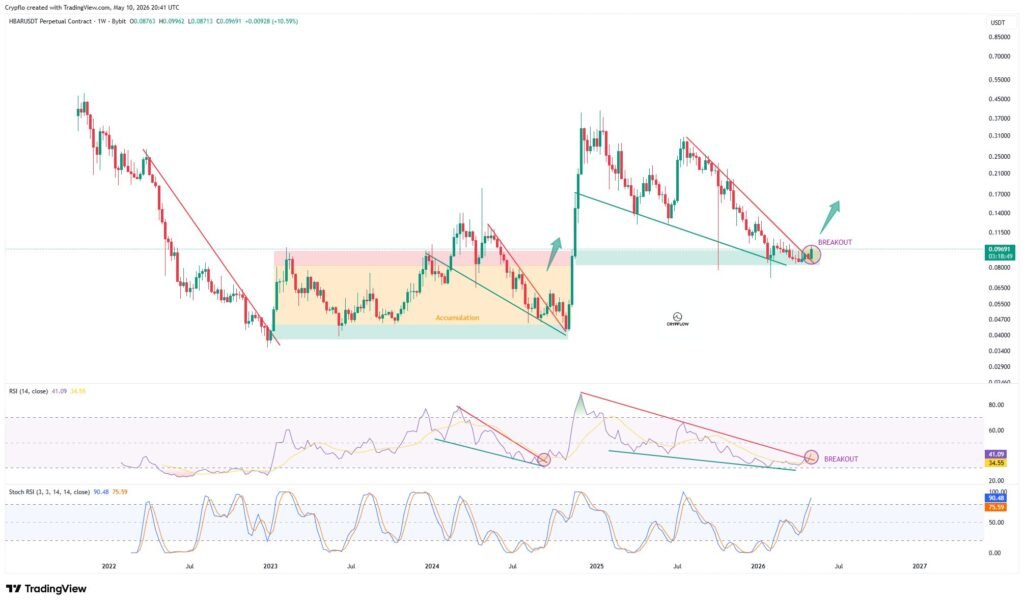
On the weekly chart, the HBAR appears to be breaking above the upper trend line of the wedge while the Relative Strength Index (RSI) is also breaking above a multi-month downtrend. The double breakout in the price and momentum structure reinforces the case for a bullish reversal.
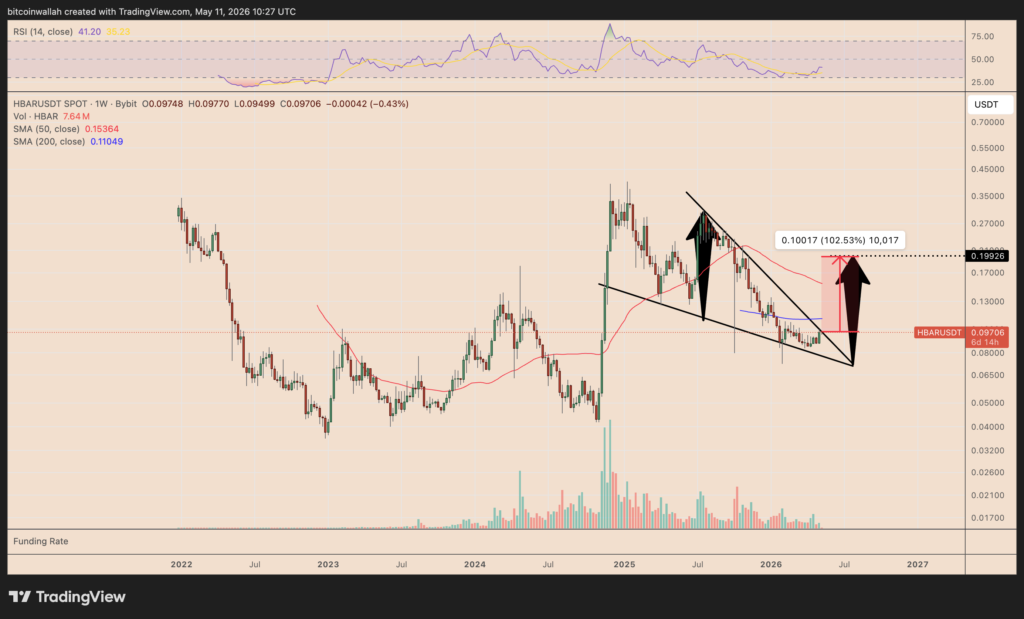
Historically, falling wedge breakouts on higher time frames tend to signal a transition from accumulation to expansion phases, especially when accompanied by improving momentum indicators. The pattern is resolved when the price rises by the maximum height of the structure.
Applying this technical rule to the HBAR charts shows that it could rise towards $0.20 in the coming weeks, an increase of more than 100% from current price levels.
CRYPFLOW indicated that a bearish cross on the RSI Stochastic may temporarily slow the rally. However, short-term momentum resets are common during early stage reversals and do not necessarily invalidate the broader breakout structure.
HBAR also benefited from improved risk appetite across cryptocurrency markets and Hedera’s catalysts, including Accenture joins the Hedera board and increasing institutional focus on token infrastructure.
The giant triangle pattern indicates a 250% rise in HBAR prices by 2027
The broader structure of HBAR also indicates a potential recovery towards the upper boundary of the multi-year ascending triangle pattern. Since 2022, the trend line has been consistently acting as long-term support, with each bounce triggering significant upward moves.
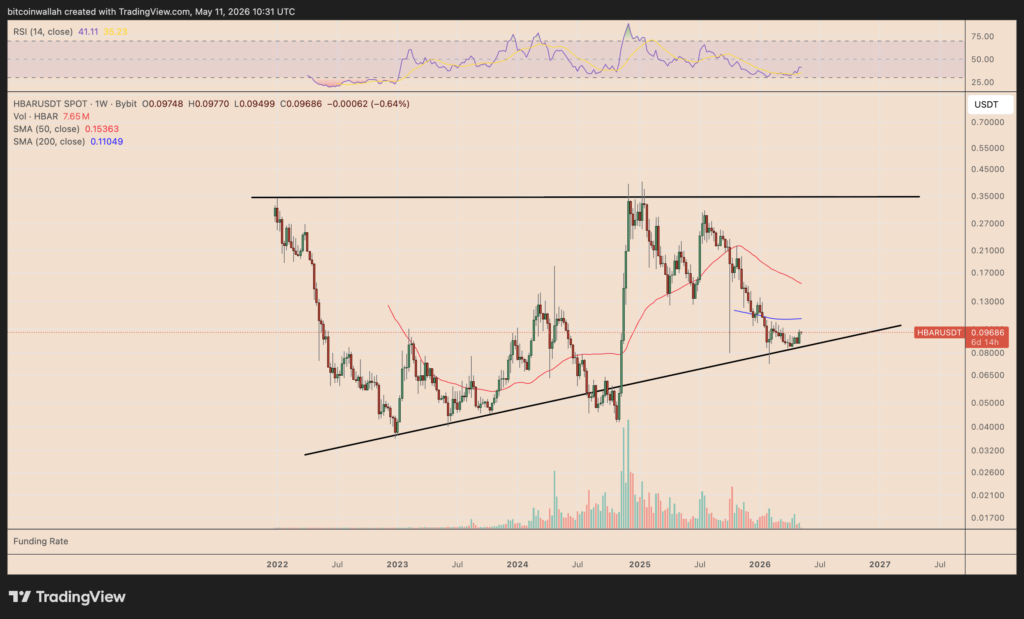
HBAR is now holding above the same upside support, now at around $0.084, while attempting to reclaim the 50-week (red) and 200-week (blue) SMAs at around $0.15 and $0.11 respectively. The weekly RSI is also moving higher from historical oversold territory, indicating weakening downside momentum.
If the support holds, HBAR could rise towards the triangle’s upper resistance near the $0.30-$0.35 area in the coming months, implying gains of more than 200% from current levels.