

Hedera’s HBAR token has faced difficulties since its ETF debut, but ETF investors haven’t given up on the trade.
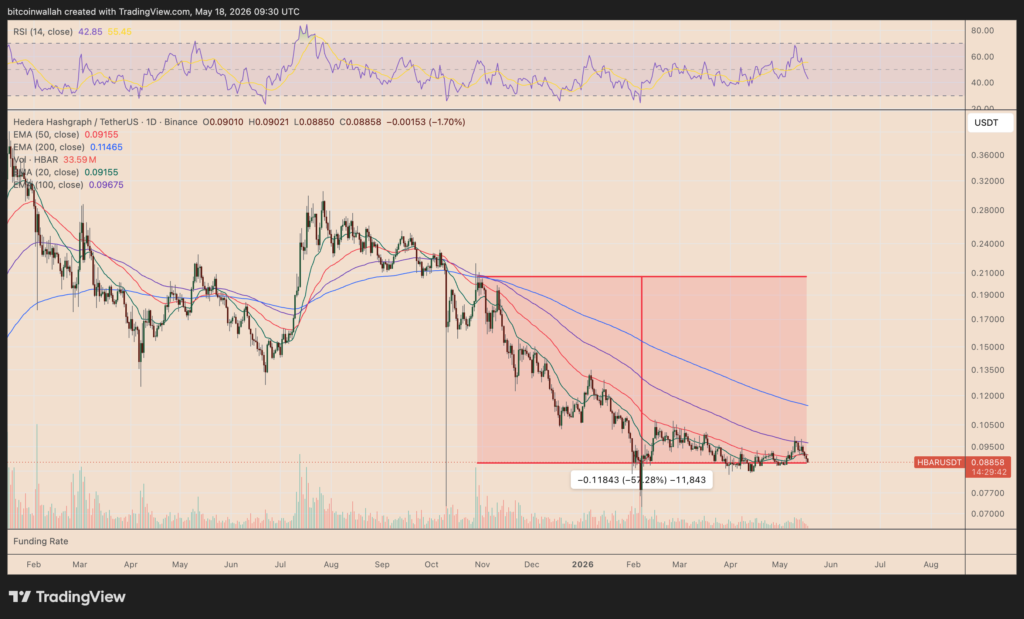
HBAR has fallen approximately 57% since the launch of the first U.S. Hedera Spot ETF on October 29, 2025, falling from about $0.21 to about $0.09 by mid-May. The decline left the token trading below major moving averages, including the 50-day moving average near $0.0915, the 100-day moving average near $0.0968, and the 200-day moving average near $0.1147.
However, ETF flows tell a more positive story. Total net assets of HBAR ETFs were about $59.25 million, according to SoSoValue data.
More importantly, Hedera ETFs have never recorded a weekly net outflow since their launch.
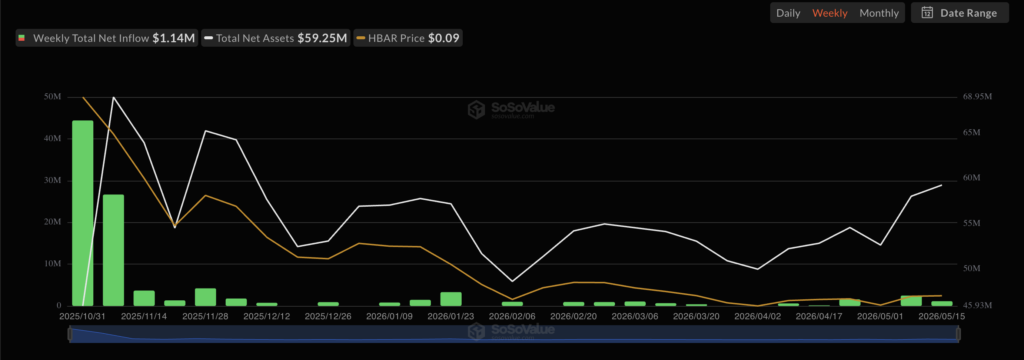
Initial demand was strongest at launch, when daily flows briefly approached $30 million, before calming down to smaller but still positive flows. This suggests that underlying institutional demand remains healthy, but is not yet strong enough to overcome broader selling pressures.
Hedera risks a 30% correction
The weekly chart of HBAR still looks structurally weak despite the token’s modest bounce attempt from descending channel support.
The price is trading within a bearish channel that has led the broader downtrend since its peak in early 2025. HBAR recently rebounded after testing the lower boundary of the channel, but the move appears weak because it came on low trading volume. This suggests there are buyers on the dip, but conviction remains limited.
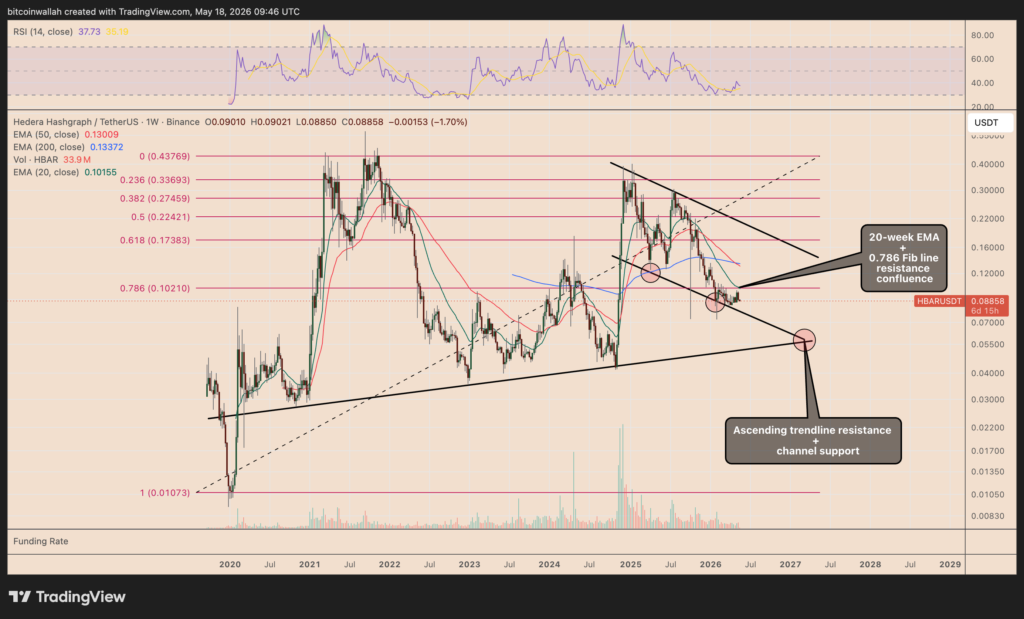
Key resistance is near $0.101, where the 20-week EMA overlaps with the 0.786 Fibonacci retracement line. This confluence makes the area important. A rejection from there may show that sellers are still in control of the trend and that the HBAR bounce is just a relief move within a broader bearish structure.
The weekly RSI also remains weak, hovering below the neutral 50 level, indicating weak momentum. Unless HBAR decisively breaks above the 20-week EMA and reclaims the $0.101-$0.102 area, the path of least resistance remains slanted to the downside.
A renewed pullback from this resistance group could send HBAR towards $0.057, where the lower support of the descending channel aligns with a multi-year uptrend line. This level, which is down 30%, could be the next major downside target and a potential long-term accumulation area if demand for ETFs remains steady.


