
Monthly trading volume per account via FM Intelligence in the first quarter of 2026 It lies within a 17x range, with Hantec Markets Group at the top of the distribution and D Prime at the bottom. The weighted average is $4.30 million per active account.
Full broker details are displayed individually on the FM Intelligence DataLab portal. Read the full analysis of trading volume per account in Q1 2026 here.
The top of the distribution is not where the largest brokers sit
The leading brokers in single account volume are not the ones who manage the largest client books. Hantec Markets, which surpassed the $1 trillion quarterly mark for the first time in Q4 2025 and set another record in Q1 2026reports approximately 30,000 active accounts in the analyzed group.
Many brokers with much larger account bases rank lower in the per-account rankings, reflecting a different mix of clients, average trade sizes and product weight.
The full rankings, including how Hantec compares to IG, Saxo Bank, CMC Markets and other names at the top level, are broken down into… FM Intelligence Data Lab Portal.
XTB falls outside the account size relationship
The group shows a fairly close relationship between numbers of active accounts and monthly trading volume, with one notable exception. The Pearson correlation between the two variables reached 0.80 when XTB was excluded from the calculation, compared to 0.45 across the full sample of 52 brokers.
Listed broker in Warsaw It added 864,000 new customers in 2025 alonea 73% year-over-year jump that pushed its base to over 2.16 million accounts. Its account totals also include non-CFD trades, making direct comparison with active CFD-only accounts at peers difficult.
FM Intelligence treats XTB as a non-comparable observation in the second correlation calculation for this reason.
What else does the full analysis cover?
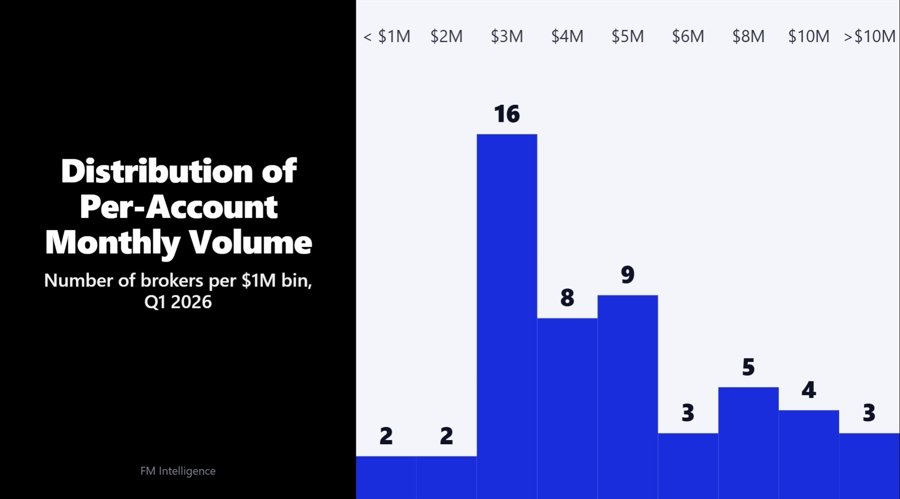
Distribution pools range between $2 million and $6 million per active account, with most brokers grouped within this range. A smaller group of seven brokers reports trading volume per account of $8 million or more, while a handful, including EC Markets and other names reported record trading volumes in the first quarterLand in the middle of the herd.
The DataLab article covers where each of the 52 brokers fits in, the quarter-by-quarter travel direction of outside names like D Prime, and the methodology behind defining the group.
Volume numbers per account are sensitive to the broker’s reporting practices, the processing of inactive or low-frequency accounts in the active count, and product mix. The metric describes the intensity of activity per account, not the account composition.
Read the full analysis of account volume for each account in Q1 2026, including a detailed broker-by-broker breakdown, on the FM Intelligence DataLab portal:Monthly volume per account in the brokerage pool in Q1 2026: $0.76 million to $13.40 million with an average of $4.30 million.
Monthly trading volume per account via FM Intelligence in the first quarter of 2026 It lies within a 17x range, with Hantec Markets Group at the top of the distribution and D Prime at the bottom. The weighted average is $4.30 million per active account.
Full broker details are displayed individually on the FM Intelligence DataLab portal. Read the full analysis of trading volume per account in Q1 2026 here.
The top of the distribution is not where the largest brokers sit
The leading brokers in single account volume are not the ones who manage the largest client books. Hantec Markets, which surpassed the $1 trillion quarterly mark for the first time in Q4 2025 and set another record in Q1 2026reports approximately 30,000 active accounts in the analyzed group.
Many brokers with much larger account bases rank lower in the per-account rankings, reflecting a different mix of clients, average trade sizes and product weight.
The full rankings, including how Hantec compares to IG, Saxo Bank, CMC Markets and other names at the top level, are broken down into… FM Intelligence Data Lab Portal.
XTB falls outside the account size relationship
The group shows a fairly close relationship between numbers of active accounts and monthly trading volume, with one notable exception. The Pearson correlation between the two variables reached 0.80 when XTB was excluded from the calculation, compared to 0.45 across the full sample of 52 brokers.
Listed broker in Warsaw It added 864,000 new customers in 2025 alonea 73% year-over-year jump that pushed its base to over 2.16 million accounts. Its account totals also include non-CFD trades, making direct comparison with active CFD-only accounts at peers difficult.
FM Intelligence treats XTB as a non-comparable observation in the second correlation calculation for this reason.
What else does the full analysis cover?
Distribution pools range between $2 million and $6 million per active account, with most brokers grouped within this range. A smaller group of seven brokers reports trading volume per account of $8 million or more, while a handful, including EC Markets and other names reported record trading volumes in the first quarterLand in the middle of the herd.
The DataLab article covers where each of the 52 brokers fits in, the quarter-by-quarter travel direction of outside names like D Prime, and the methodology behind defining the group.
Volume numbers per account are sensitive to the broker’s reporting practices, the processing of inactive or low-frequency accounts in the active count, and product mix. The metric describes the intensity of activity per account, not the account composition.
Read the full analysis of account volume for each account in Q1 2026, including a detailed broker-by-broker breakdown, on the FM Intelligence DataLab portal:Monthly volume per account in the brokerage pool in Q1 2026: $0.76 million to $13.40 million with an average of $4.30 million.


