


TLDR
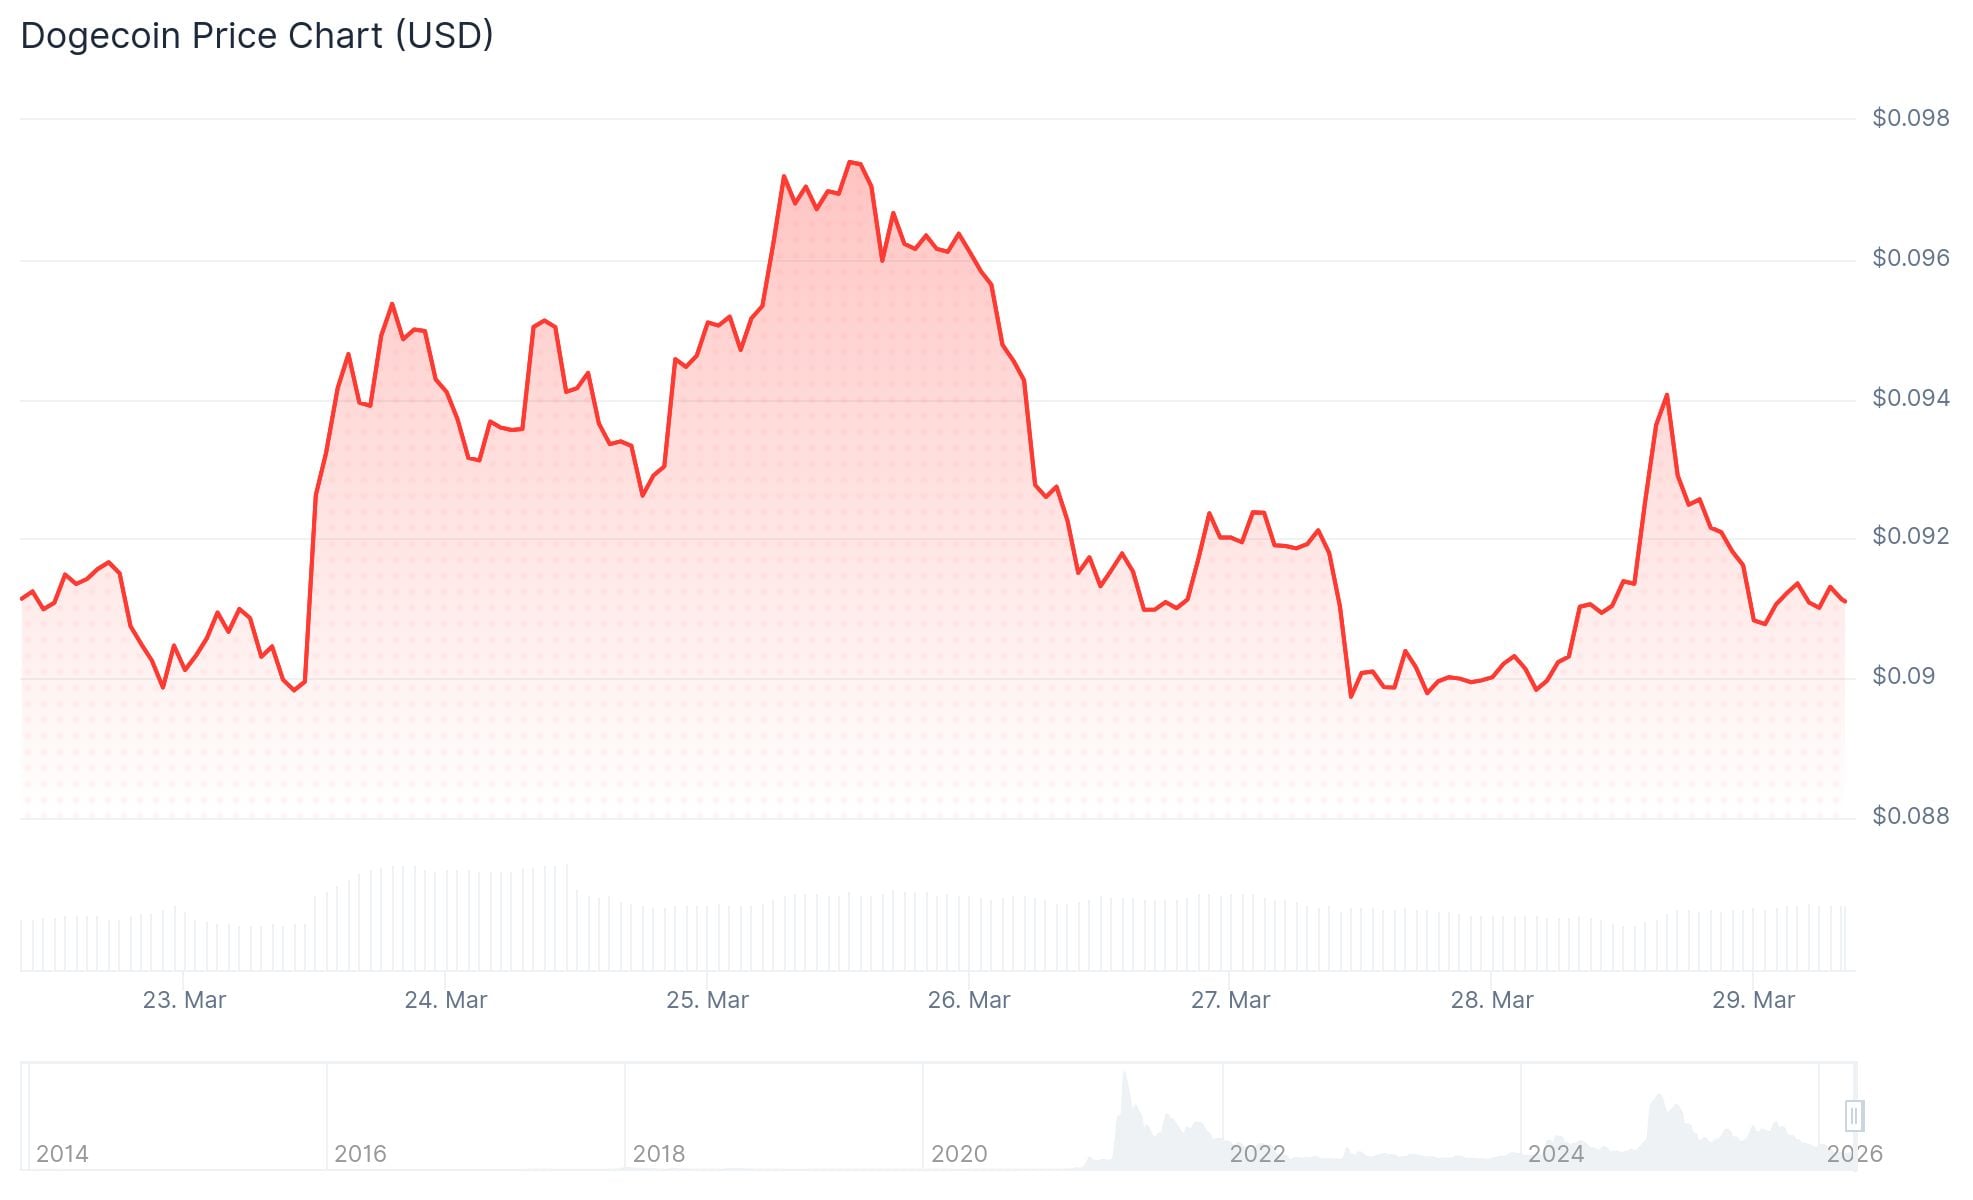
- Dogecoin is trading at $0.09106, the depth of what previous sessions call the correction and consolidation phase.
- The chart prepared by analyst Bitcoinsensus shows that Cycle 3 structurally mirrors Cycles 1 and 2, which generated returns of 5,800% and 21,000%, respectively.
- Each DOGE cycle set a higher low – the first cycle bottomed near $0.000020, the second cycle near $0.00070, and the third cycle settled above $0.09.
- Binance data shows that traders are increasing long positions, with the ratio of long to short positions rising depending on calculations and volume.
- DOGE ETF flows remain steady at zero daily net inflows, with total net assets of approximately $9.12 million and no new institutional capital coming in.
Dogecoin (DOGE) is trading at around $0.09106. The meme attracted attention after a chart shared by cryptocurrency analyst Bitcoinsensus went viral, comparing three separate DOGE price cycles side by side.
The first cycle returned over 5800%. The second cycle went even further, recording gains of more than 21,000%. They both followed the same basic form: a slow buildup, a sharp rise, then a big correction. The third cycle seems to follow the same path.
DOGE reached the cycle peak near $0.70 before pulling back. It has since traded lower and is now consolidating in the $0.09 to $0.10 range.
$dawg Macro Courses Overview 📈🔥#Dogecoin They have historically followed recurring cycle patterns, often following side by side #Bitcoin
This current cycle seems a little longer compared to previous cycles 🚀
Although no outcome is guaranteed, this chart provides a potential roadmap… pic.twitter.com/7TOehiVyQq
— BitcoinSensus (@Bitcoinsensus) March 27, 2026
One of the most consistent patterns across the three cycles is that each decline was higher than the previous one. The first session bottomed near $0.000020. The second session found a floor at $0.00070. The third session remained above $0.09 during the current draw.
This pattern of high-lows indicates buyers are entering at higher price levels with each new cycle. This suggests that the asset was attracting a broader base of participants over time.
Traders on Binance are bullish
Binance data shows a shift in how active traders are positioned. The ratio of buying to selling has increased among large traders, both in terms of the number of accounts and the size of the position. This means that more traders are betting on DOGE to move higher, and some are adding to those bets rather than closing it out.

Best traders on Binance $XRP Long positions are increasing.
The long and short positions were similar, but now the long positions are turning into the upper hand. pic.twitter.com/kr5bNlEyHC
– CW (@CW8900) March 25, 2026
This type of setup can reflect growing confidence, although it also means that the market is becoming more one-sided. When too many traders lean the same way, short-term pullbacks can follow.
However, the current situation shows that accumulation is occurring at current price levels, and not simply a reaction to price action that has already occurred.
Technical signals indicate a calm market waiting for a trend
Looking at the indicators, the RSI is near 42 – neither overbought nor oversold. MACD indicator is flat. The ADX index is around 15, which confirms that there is no strong trend in either direction at the moment.
Bollinger bands are tight, with resistance near $0.10 and support near $0.09. When bands are compressed like this, they tend to come before a larger move.
A break above $0.10 could open the way towards $0.15. If the support at $0.09 is broken, there will be further decline.
On the ETF side, daily net flows reached zero. The total net assets are approximately $9.12 million with no significant growth. Institutional capital has not moved in any noticeable direction through this channel.
$dawg Sitting in a generational buying area (imho)!! There’s no reason why this thing can’t hit $10+ this course! #DOGE She’s done it 100x before, and she can do it again. pic.twitter.com/Kkox1VuG9i
— Vuori Trading (@VuoriTrading) March 26, 2026
Vuori Trading analyst on X posted this Doug It sits in what they called “generational buying territory,” saying there’s “no reason this thing can’t hit $10+ this cycle.”
ETF flows remain steady at zero daily net flows, with total net assets near $9.12 million.


