


TLDR
- Previous Bitcoin bear markets saw declines of 77-85% from the peak; Similar moves from the 2025 high of $126,198 could mean lows near $19,000-$29,000.
- Analysts say the current decline looks more like a correction within a longer uptrend than the start of a full-blown bear market.
- The most likely lower zone appears between $58,000 and $68,000, with a deeper flow into the $48,000 to $58,000 range likely.
- Previous Bitcoin cycles bottomed roughly 12 to 13 months after their peak, suggesting an October-November 2026 window — but the current chart clearly doesn’t support that timeline.
- Key signals to watch for a confirmed bottom include a strong weekly close, reclaiming resistance, and a weekly RSI reversal.
Bitcoin reached an all-time high of $126,198 on October 6, 2025, according to CoinGlass. Since then, the price has fallen to around $71,000, raising the question that arises every cycle: Is this a correction or the beginning of something much worse?
History gives some context. Bitcoin They are down about 85% from their peak in 2013, 84% from their peak in 2017, and 77% from their peak in 2021. If the same range of decline from $126,198 plays out, prices could fall from $19,000 to $29,000 in the extreme scenario.
But technical analysis of the weekly chart indicates that this cycle may not follow this exact path. The long-term upward channel remains intact. The current move looks more like a pullback after a failed push near the top of this structure than a collapse in a multi-year bear market.
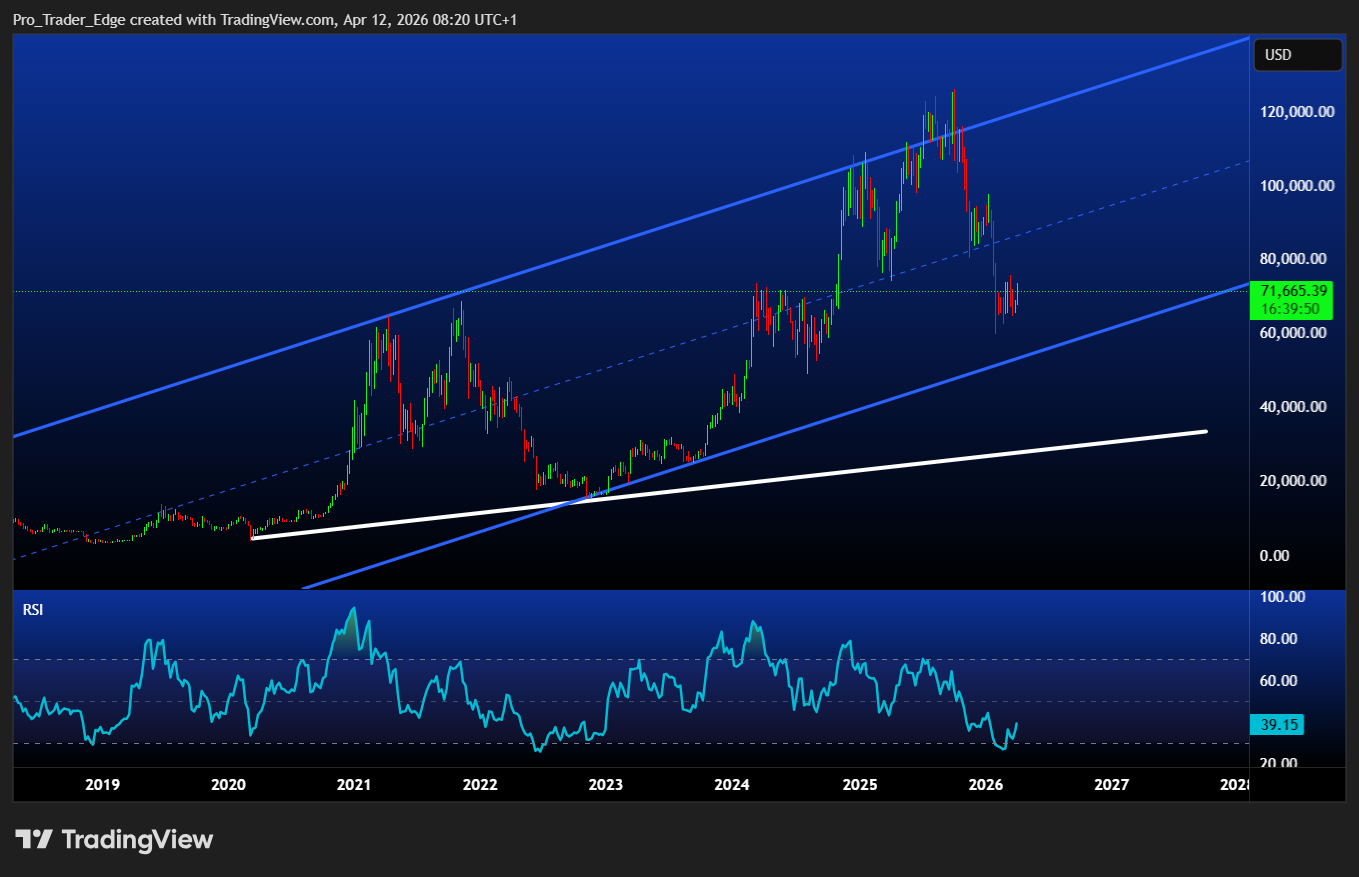
However, analysts do not believe that the bottom has already been reached. The weekly RSI remains weak, and momentum is unchanged. The market appears damaged but not completely washed out.
Where the bottom could be
The most likely bearish zone, based on the chart, is between $58,000 and $68,000. This represents a decline of approximately 46% to 54% from its peak in October 2025.
A deeper run to $48,000 to $58,000 – a 54% to 62% decline – is also possible if fear leads to a sharper sell-off. Both scenarios are painful, but much higher than the 80% that occurred in past cycles.
There is also a more optimistic case. If buying returns quickly, a low between $68,000 and $74,000 cannot be ruled out.

In past cycles, Bitcoin bottomed about 12 to 13 months after the previous peak. This would put a potential October-November 2026 low if the October 2025 high is the true cycle high.
What the chart says now
However, the current chart clearly does not look like a completed break-and-break pattern. It looks like a major reset within a higher time frame structure that is still rising.
If this reading continues, the bottom could be reached within weeks to a few months rather than late 2026.
Chart signals that would confirm a bottom are a strong weekly close, a recovery of nearby resistance levels, and a weekly RSI shift to the upside. None of that has happened yet.
Bitcoin At $71,000 it’s cheaper than it was near the highs, but analysts don’t yet see a clean, high-confidence low.
Final thoughts
Investors looking to the bottom should think about price zones rather than individual targets. The upside is a shallow bottom near $68,000-$74,000. Base case remains $58,000-$68,000. Below $48,000, the picture will start to look like a true bear market rather than a correction.


