

Bitcoin is holding just above the broken support level at $66,900, as a potential bearish flag is forming on the 4-hour chart and the daily MACD reaches one of the most negative readings of the current session, increasing the risk of a move towards $63,000 heading into the low-liquidity Good Friday weekend.
summary
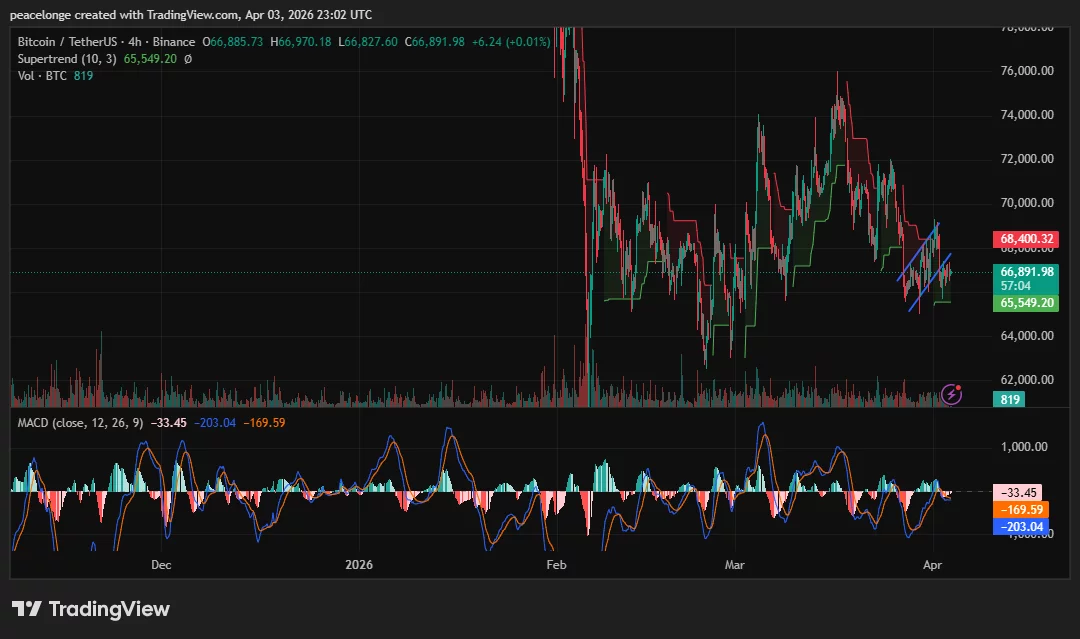
- Bitcoin is trading at $66,891, holding just above the broken support level of $66,188 after a sell-off from the March peak near $76,000.
- The 4-hour chart shows a small upward channel forming within a downtrend, a structure that could represent a bear flag, while the daily MACD chart is at -639, one of the most extreme negative readings in the current session.
- A failure of the $65,549 Supertrend support targets $63,000, while a confirmed daily close above $68,400 would be the first sign of relief in the short term.
Bitcoin (Bitcoin) is trading at $66,891 on April 3, 2026, holding just above the previous horizontal support at $66,188 after falling from the March high near $76,000. The daily Supertrend indicator is at $74,093, well above the price in red, confirming the prevailing bearish regime. Trading volume on the daily chart rose sharply during the recent bearish wave, a pattern that is broadly consistent with forced selling rather than orderly distribution.
On the 4-hour chart, the price has formed a small upward channel since the low over the last day, with the current close near $66,891 just above the 4-hour Supertrend support at $65,549. This short-term structure initially looks constructive on the 4-hour chart, but it is located within a much larger downtrend, raising the possibility that it is a bearish flag rather than a true reversal.
A bear flag is a short, shallow recovery that forms within a downtrend before the next stop down. The 4-hour bullish channel on the Bitcoin chart fits this description: the price is recovering at a modest angle, and the MACD histogram on the 4-hour time frame remains very negative at -169, with the MACD line at -203 compared to the -33 signal. There is no bullish crossover on the 4-hour MACD indicator, and the chart continues to expand in red.
On the daily chart, the MACD readings are more extreme. The MACD line stands at -862 against a signal of -223, producing a histogram of -639. An April 3 technical assessment by Investtech notes that Bitcoin “has broken the floor of a short-term uptrend channel” and broke support at $67,300, concluding that “this predicts further decline.” The 50-day SMA at around $69,089 and the 200-day SMA near $70,280 are above the current price on downward paths, offering stacked resistance on any recovery attempt.
Key levels, price targets, and invalidation
Immediate support is at $65,549, which is the current 4-hour Supertrend reading. A four-hour close below this level will likely accelerate the move towards $63,000-$64,000, the next major support area from price history in early 2026. A deeper break below $60,490 targets $54,000, according to technical analysis published by CoinDCX.
Uptrend Resistance: The broken level at $66,188 now represents a pullback to resistance. The upper boundary of the 4-hour up channel near $68,400, which is also in line with the bears’ 4H Supertrend line, is the first meaningful ceiling. A confirmed daily close above $68,400 would neutralize the bear flag hypothesis and open a comfortable rally towards $70,000.
Options expiration and market context
About 27,600 Bitcoin options contracts expired on April 3 with a notional value of nearly $1.8 billion and a maximum pain level of $68,000, according to data from Coinglass. A call/put ratio near 0.55 shows slightly more calls than options expiration, but with prices trading below the pain limit, options-based retracement faces an uphill battle.
Such as crypto.news I mentionedBitcoin fell more than 4% to $66,250 on April 2, as escalating tensions between the United States and Iran pushed oil past $100 and caused more than $420 million in liquidations across the market. CME futures are closed today for Good Friday, removing institutional demand and liquidity at a critical juncture.
The CoinDCX research team noted that a “sustained daily close of the $67,500 support area” is needed for a 5-7% April recovery towards $72,000 to remain viable. Failure to reclaim this level next week, combined with a very negative daily MACD, places $63,000 as the most likely next trend target.


