

Solana price fell by 13% over the past week after confirming the bearish pattern on the charts. Will it see a sharper decline in the future as institutional investors appear to pull back from the asset?
summary
- Solana price fell more than 13% in a week after the bearish flag pattern was confirmed, indicating a potential continuation of the downtrend.
- Institutional outflows from Solana ETFs and derivatives-based divestitures have increased selling pressures, dampening investor sentiment.
- Technical indicators point to further downside risks towards $67, and a break below $80 is likely to accelerate losses.
According to data from crypto.news, Solana (Sol) The price fell 13.5% from a weekly high of $92.88 to $80.37 earlier on Monday before settling just above $84.07 at the time of writing.
Solana’s price fell as institutional investors began rotating capital away from the token, likely as they explored other options. Data From SoSoValue shows that Solana ETFs recorded $4.24 million in outflows over the past week, breaking a six-week streak of weekly inflows that attracted nearly $127 million from investment products.
While this recent lull does not necessarily mean that institutional investors will continue to retreat from the asset in the coming weeks, they have certainly pushed retail investors into a state of caution as they wait for clearer market signals.
Another major reason that led to the token setback is the ongoing liquidations across cryptocurrency derivatives markets. Over the past 24 hours, over $24 million worth of positions were liquidated from Solana alone, most of which came from long-term liquidations. As these positions were erased, the resulting selling pressure accelerated the decline.
Meanwhile, the ongoing uncertainty about when the war between the United States and Iran will end has also ended Fostered a cautious environment For investors turning to gold and other safe-haven assets that have historically protected capital during geopolitical crises.
On the daily chart, Solana price has confirmed a multi-month bearish flag pattern. Such a pattern is formed when the asset drops sharply to the bottom, forming a flagpole followed by some consolidation that forms the flag portion of the pattern.
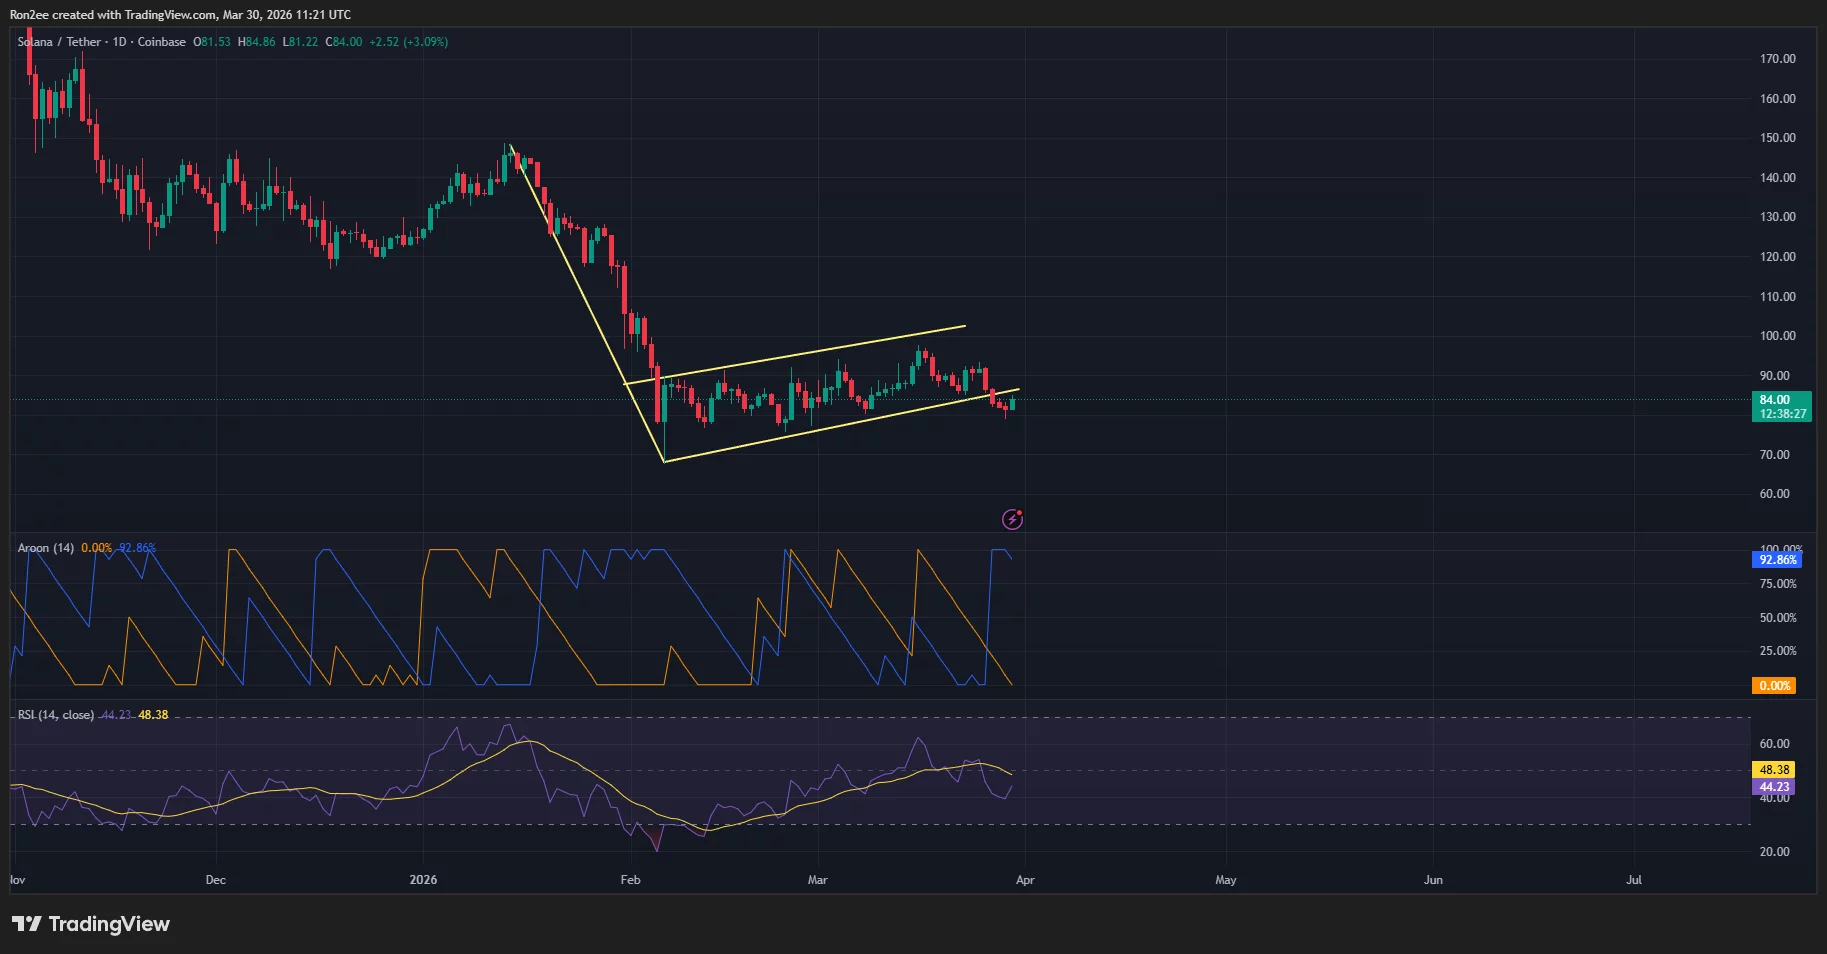
A breakout from the lower trend line of the pattern confirms bearish expectations and often precedes a significant downward move.
Hence, Solana price is likely to reach its YTD low of $67.82 which it reached on February 6. On the downside, if Solana price loses the support level at $80, the selling could intensify quickly.
Technical indicators appear to support this bearish outlook. It is worth noting that the Aroon Down indicator reached 92.86% while the Aroon Up indicator was at 0%, indicating that the bears are in complete control of the trend.
The Relative Strength Index, which shows the RSI at 44 slowly rising towards the neutral threshold, indicates that although the immediate panic has subsided, the overall momentum remains weak.
Disclosure: This article does not constitute investment advice. The content and materials contained on this page are for educational purposes only.


