XRP price is looking for a bullish breakout from the symmetrical triangle pattern that could put it in for a breakout above $1.50, a level it has remained below for the past five weeks.
summary
- XRP is trading near the upper trendline of a symmetrical triangle, with a break above $1.50 potentially indicating a continuation of the previous uptrend.
- Bullish signals are appearing as the Supertrend turns green and the MACD trends upward, indicating rising buying momentum.
- Downside risks remain if the support level at $1.20 is broken, which could lead to a deeper correction towards the $1.00 level.
According to data from crypto.news, XRP (XRP) The price fell 3% to an intraday low of $1.41 on Thursday. At this price, the token is 40% below its year-to-date high of $2.36.
While the token, along with the broader cryptocurrency market, remains under intense pressure from geopolitical tensions that have reduced investors’ appetite for risky assets, its charts tell a different story.
On the daily chart, it has been forming a consistent symmetrical triangle pattern since the beginning of February. This formation is a crucial technical setup as a breakout from the upper trend line tends to indicate a continuation of the previous uptrend, while a breakout below the lower support level indicates more downside momentum.
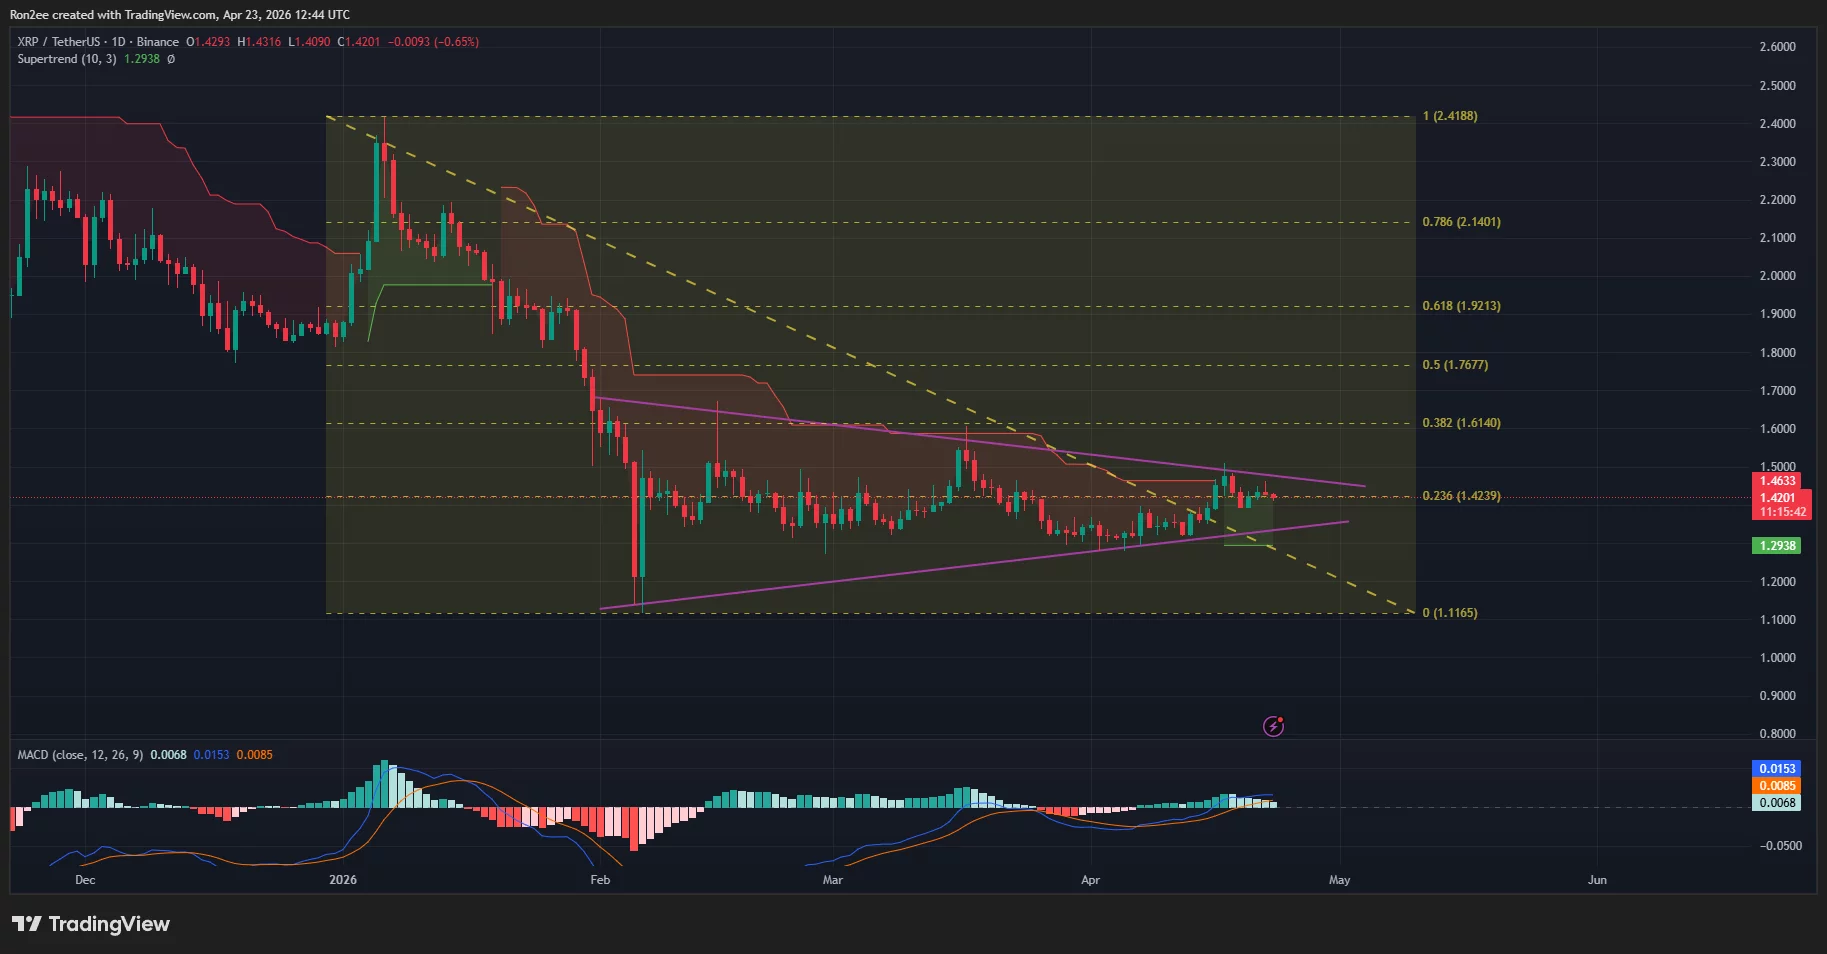
In the case of XRP, it is trading near the upper trend line, where technical indicators suggest that bulls could successfully start breaking out from it.
Notably, the Super Trend Index recently flipped green for the first time since late January. When this metric turns green, it means that the prevailing market trend has shifted from bearish to bullish.
Meanwhile, the MACD lines are pointing higher, indicating that buying momentum is building and a bullish crossover is likely imminent.
XRP price was also trading near the 23.6% Fibonacci retracement level at $1.42. Hence, XRP is likely to make a bullish breakout from the triangle pattern and rise respectively towards $1.61, which is in line with the next Fibonacci retracement level in the series.
Conversely, if XRP price loses the $1.2 support, the bullish hypothesis will be invalidated and may lead to a deeper correction towards the $1.00 psychological level.
Disclosure: This article does not constitute investment advice. The content and materials contained on this page are for educational purposes only.