

Bitcoin was trading at US$79,732 as of May 7, down 2% over 24 hours, after a sharp rejection of a five-month high of US$82,784 reached in two previous sessions. This is not very bullish news for Bitcoin today.
This reversal pulled Bitcoin below the $80,000 psychological limit, a level it has now failed to sustain structurally across three separate tests in four months.
The analytical question is no longer whether Bitcoin can reach $80,000; Rather, it is whether the structural conditions exist to convert that level from ceiling to floor.
On-chain data, derivatives positioning, and technical indicators are currently consistent with this conversion, even as institutional investment flows remain high, a discrepancy that defines the fragility of the current setup.
discovers: Meme Coin Supercycle: Best performer this week
$80K Level: What Bitcoin’s price structure actually shows
In the current BTC price analysis, the four-hour chart identifies $80,513 as an immediate resistance level that Bitcoin must reclaim and close above to indicate any reliable bullish reconfirmation.
This level is not arbitrary; It represents the base of the supply group that capped the price during the consolidation period in late April and has since flipped from support to general resistance after the failed breakout at $82,784.
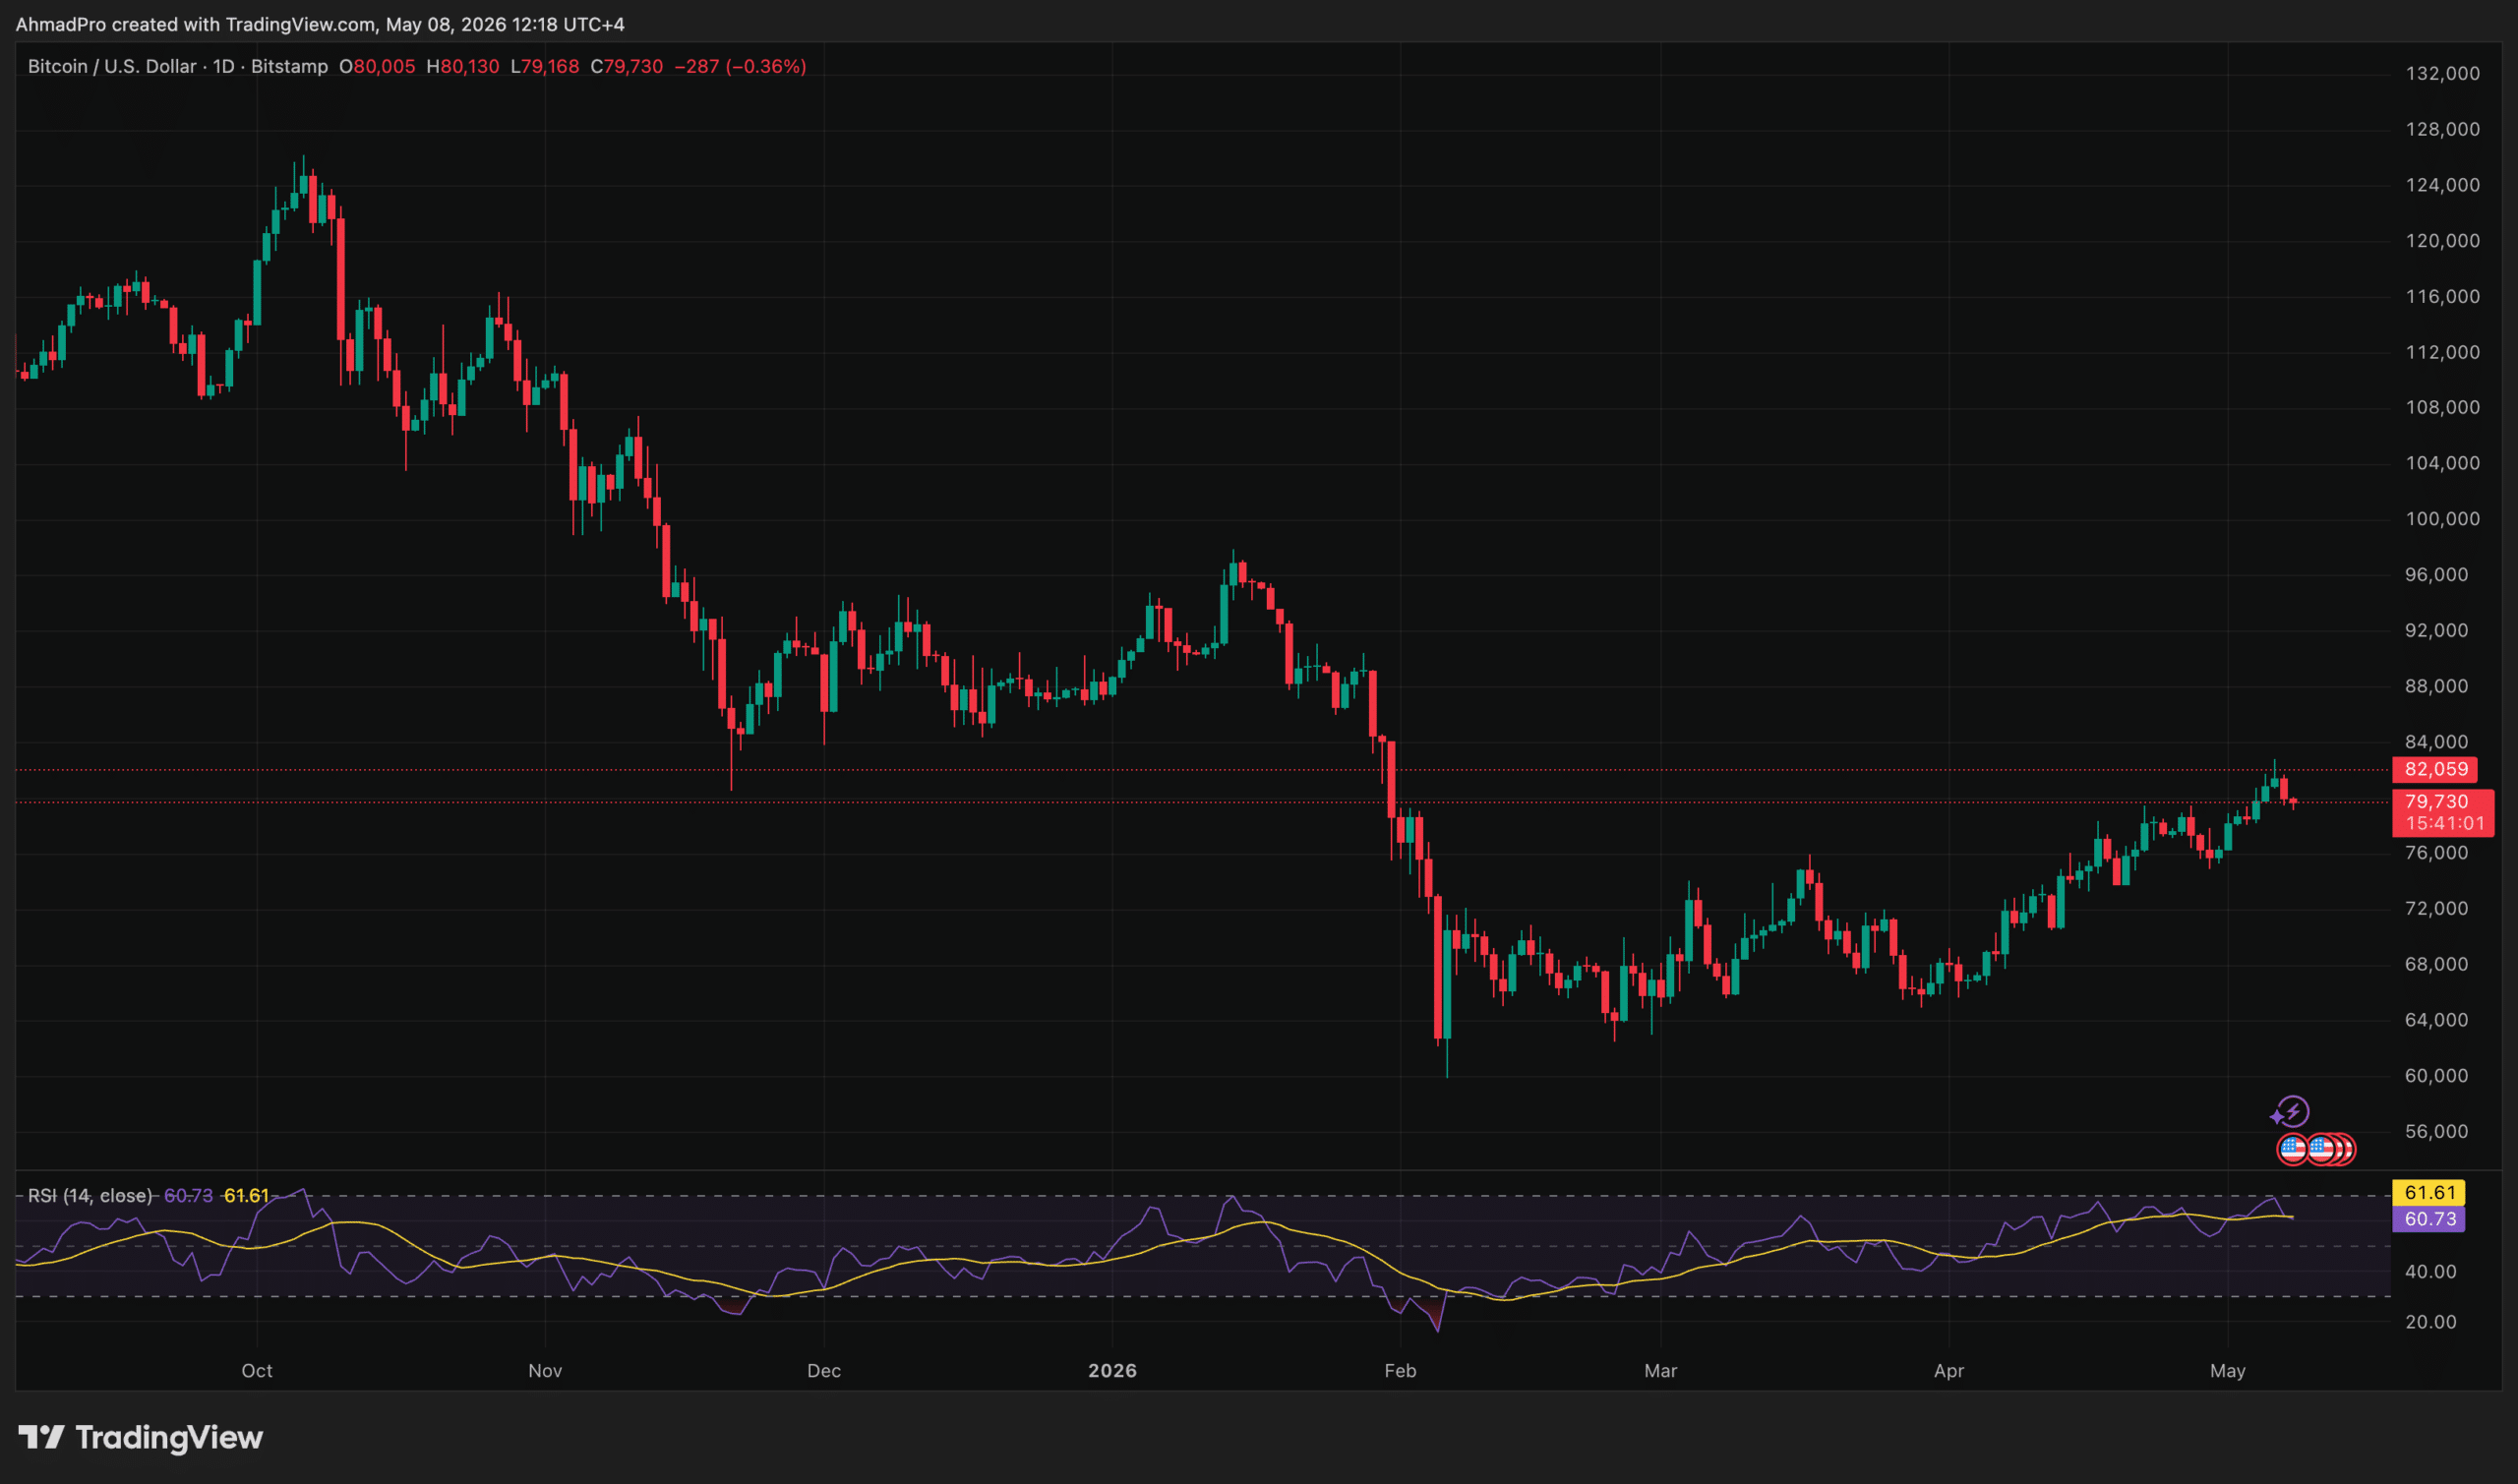
Source: TradingView
The significance is not that Bitcoin reached $82,784; Which is that it cannot be closed over by a large volume. According to data tracked by TradingView, trading volume rose 25% to $45 billion on May 7 during the rally above $80,000, but faded 15% in the subsequent reversal, the classic exhaustion signature of a mechanical breakout rather than structural demand. Intraday wicks in the $81,000-$82,000 range without a sustained daily close above $80,513 confirm that the level is acting as resistance, rather than as a free zone.
The immediate bearish structure places first support at $79,135, which has already been tested at press time, followed by a more significant demand set at $74,857. The 200-day simple moving average is $83,435. The next material overall target, should bulls reclaim $80,513, while the 100-day moving average at around $72,000 provides dynamic bearish support. A daily close below $79,135 on high volume would indicate that the current bearish structure is deepening rather than strengthening.
explores: Cryptocurrency hack alerts this week
Bitcoin News Today: Can Institutional Flows Bring $80K From Ceiling to Floor?
If you read the news today, it is clear that the institutional investment case for Bitcoin remains largely sound. Spot Bitcoin ETFs recorded net inflows of $623 million on May 1 alone, the highest single-day number in three weeks, suggesting that institutional accumulation has continued even as the spot price has declined.
This inflow volume reflects a structural commitment to exposure to Bitcoin that is distinctly different from the retail-driven demand cycles of previous years, a dynamic examined in detail in Goldman Sachs Expands Bitcoin ETF Position and Wall Street’s Growing Balance Sheet Commitment.
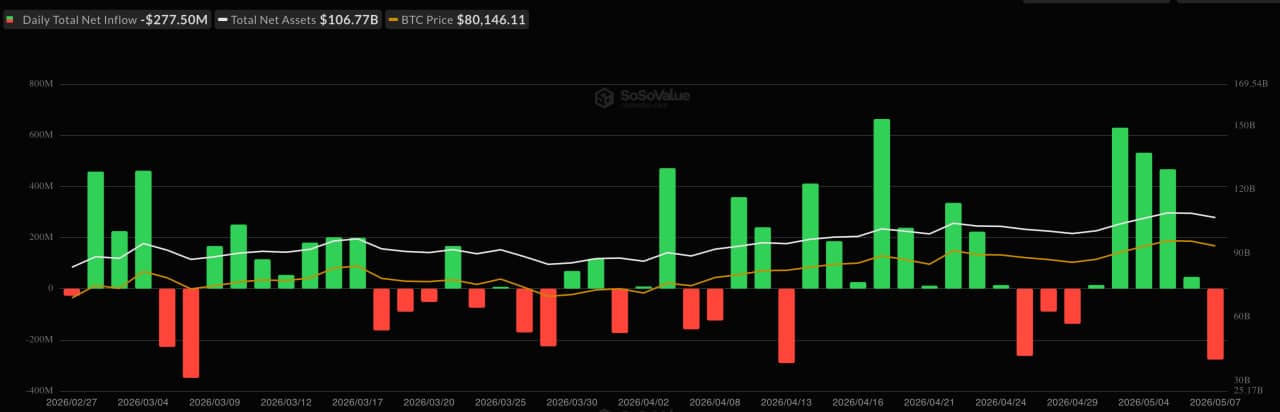
Source: Soso Value
Complexity in the transport mechanism. Inflows from institutional ETFs do not automatically produce spot price support, as they must unload accumulated derivatives before they can raise the structural floor.
Open interest in BTC Futures rose 7% to $60 billion as of May 7, according to Coinglass, concentrating liquidation risks precisely at the level where institutional buyers were accumulating. This dynamic played out with mechanical precision: Bitcoin’s 24-hour liquidations totaled $105.45 million, with long liquidations amounting to $93.87 million compared to just $11.58 million on the short side.
The Bull Bear Power indicator directly determines what the filter data indicates. The BBP price turned negative on May 7, recording 1,614 after remaining consistently positive from May 1 through May 6, the specific period that aligns with Bitcoin moving towards a five-month high. At the same time, the Aroon bottom line reached 92.86%, a reading close to the 100% threshold indicating a confirmed new low during the measurement period. Institutional flows are real; Its ability to absorb selling pressures resulting from financial derivatives in the near term has not yet been proven.
Disclaimer: Coinspeaker is committed to providing unbiased and transparent reporting. This article aims to provide accurate and timely information but should not be considered financial or investment advice. Since market conditions can change rapidly, we encourage you to verify the information yourself and consult with a professional before making any decisions based on this content.

Neil is a professional cryptocurrency content writer with years of experience. He has written for numerous cryptocurrency websites to report breaking news, and has been hired by all kinds of cryptocurrency projects, to create content that will increase their exposure and attract more potential investors.


