
Bitcoin pulls back from the upper border of its ascending channel on Powell’s FOMC final day, with a daily bearish MACD cross confirmed and the price falling towards key SMA support. This article explains what the daily chart indicates, where the price could go next, and why the Fed’s transition to incoming Chairman Kevin Warsh adds a new layer of uncertainty.
summary
- Bitcoin is trading at $75,834 on April 29, down 0.67% during the session, as a daily bearish MACD crossover confirms a momentum shift.
- The price has pulled back from the upper border of the ascending channel and is now pressing the 20 SMA at $75,685 as immediate support.
- If the 20 SMA fails, the next floor is at the 50 SMA near $72,082; A confirmed close above $80,000 invalidates the bearish setup.
Bitcoin (Bitcoin) is trading at $75,834 on April 29, down 0.67% on the day, having reached a high of $77,904 before sellers reasserted control ahead of the Fed’s interest rate decision. The pullback comes as Jerome Powell holds his final FOMC press conference before his term ends on May 15, and with the daily MACD chart turning negative for the first time in several weeks, suggesting that the momentum that propelled April’s 21% rebound is beginning to wane.
MACD daily bearish crossover at descending channel resistance
The daily chart shows that Bitcoin is moving between two overlapping structures. The upward channel from the February lows near $59,000, defined by two parallel blue trend lines, remains intact and has defined the entire recovery through April. However, a broader down channel formed by two red trend lines extending from the February highs near $85,000 is capping the overall recovery, with the 200 SMA at $84,423 within this upper boundary as key overall resistance.
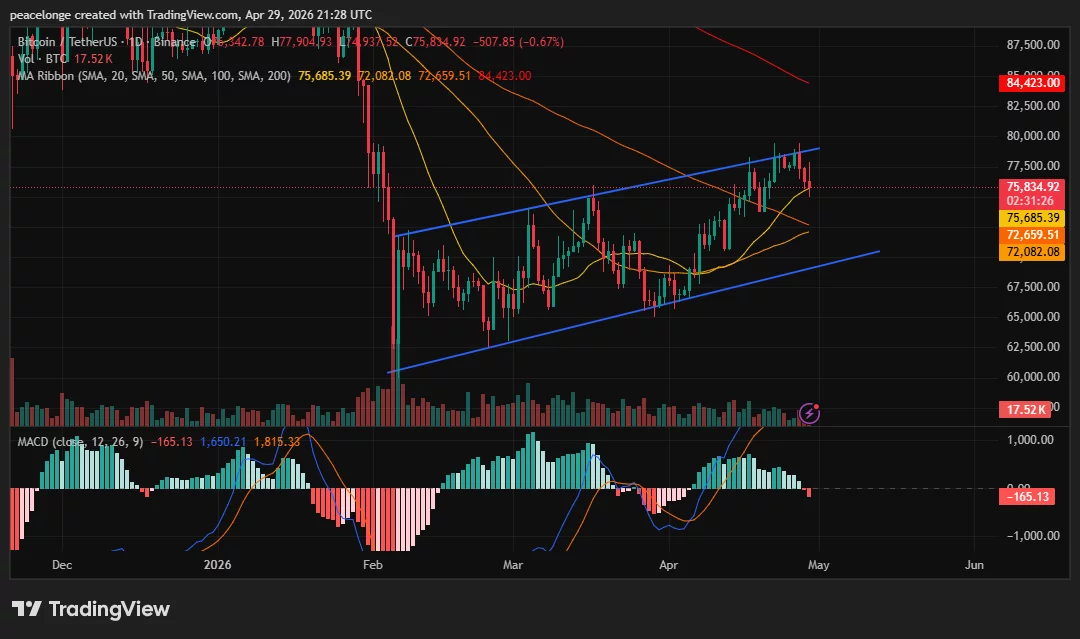
The price tested the upper area of the ascending channel near $78,000 on April 28, then pulled back sharply, producing a current session high of $77,904 before sliding to $75,834 at the time of writing. The important technical development on the daily chart for today is the MACD indicator. The MACD line reads at 1,650.21, the signal line at 1,815.33, and the histogram at -165.13, confirming a bearish crossover on the daily time frame. Cryptocurrency analyst Michael van de Poppe He said On
Key levels: support, resistance and price targets
Immediate support is the 20 simple moving average at $75,685, which is the price it is currently putting pressure on. A daily close below it removes the first dynamic buffer and puts the 50 SMA at $72,082 and the 100 SMA at $72,659 under focus, both of which are converging into a narrow block near the $72,000 to $73,000 region which analysts identify as the lower limit of an upward channel. A confirmed close below $72,000 would break the upward channel structure and open a retest of the $65,000 to $68,000 range, where heavy on-chain accumulation occurred throughout the Iran-led correction in Q1 2026.
On the upside, $80,000 remains the key resistance level and bullish case target that would negate the current bearish MACD reading. Above it, the 200 SMA at $84,423 and the upper limit of the descending red channel represent the overall level that the bulls must cross for a confirmed structural trend reversal. A confirmed daily close above $80,000 in volume would shift the near-term bias back toward neutral.
ETF flows and derivatives context
According to data tracked by crypto.newsBitcoin exchange-traded funds recorded $89.68 million in net outflows on April 28, breaking an eight-day streak of inflows that totaled $2.43 billion. Bitcoin fell after eight of the last nine FOMC meetings within 48 hours of the decision, according to the data Published by Vimixwith the pattern being led by traders unwinding long positions before the event rather than by the price decision itself. The current setup, where BTC entered the FOMC at a 21% rally in April with the Fear and Greed Index near 40, closely mirrors the previous settings that produced the largest post-meeting declines.
Powell’s exit and uncertainty at Warsh
This meeting carries an additional layer of uncertainty beyond the interest rate decision. Powell’s term ends on May 15, and new Chairman Kevin Warsh is expected to chair the June 16-17 FOMC meeting as his first. As reported by crypto.newsInstitutional flows have proven sensitive to changes in the tone of the Fed’s communications throughout 2026, with oil prices approaching $105 per barrel adding pressure to interest rate cut expectations. Warsh’s hawkish reputation for Powell could shift the June dot chart in a direction that tightens liquidity expectations for risk assets, making the 48-hour post-FOMC window on April 30 and May 1 a critical test of whether this pullback stabilizes or extends toward $72,000.
If Bitcoin holds the 20 SMA at $75,685 and reclaims $77,500 on the daily close, the upward channel will remain intact and a bearish MACD crossover may act as a temporary signal. A close below $72,082 confirms that a deeper correction is underway.