
Bitcoin price fell to a crucial support area near $59,000 after losing a key Fibonacci level that traders considered the last major defense before a deeper sell-off.
summary
- Bitcoin price fell back to the June low near $59,000 after missing the critical 78.6% Fibonacci retracement level.
- Technical indicators remain bearish, with BTC trading below key moving averages and sellers dominating the momentum.
- Analysts see the $59,000-$60,000 area as the last major support area before the risk of a deeper correction increases.
According to data from crypto.news, Bitcoin (Bitcoin) The price fell to around $59,175 on June 24, continuing a decline that erased almost all of the recovery from that month’s low. The decline came after the price failed to hold above the 78.6% Fibonacci retracement level near $64,270, an area that many traders consider final support before a full retracement of the previous high.
The move took Bitcoin back to the 100% Fibonacci level near $59,193, which also coincides with the June low. A break below that area would put the market at its weakest level since the rally that followed the April correction.
Bitcoin price erased most of its May rebound
The daily chart shows that Bitcoin is reversing almost the entire advance from the June lows to the May high near $82,900. During the decline, Bitcoin price lost support at the 61.8% Fibonacci retracement level near $68,250 and the 78.6% retracement level near $64,270 before sliding back towards the origin of the move.
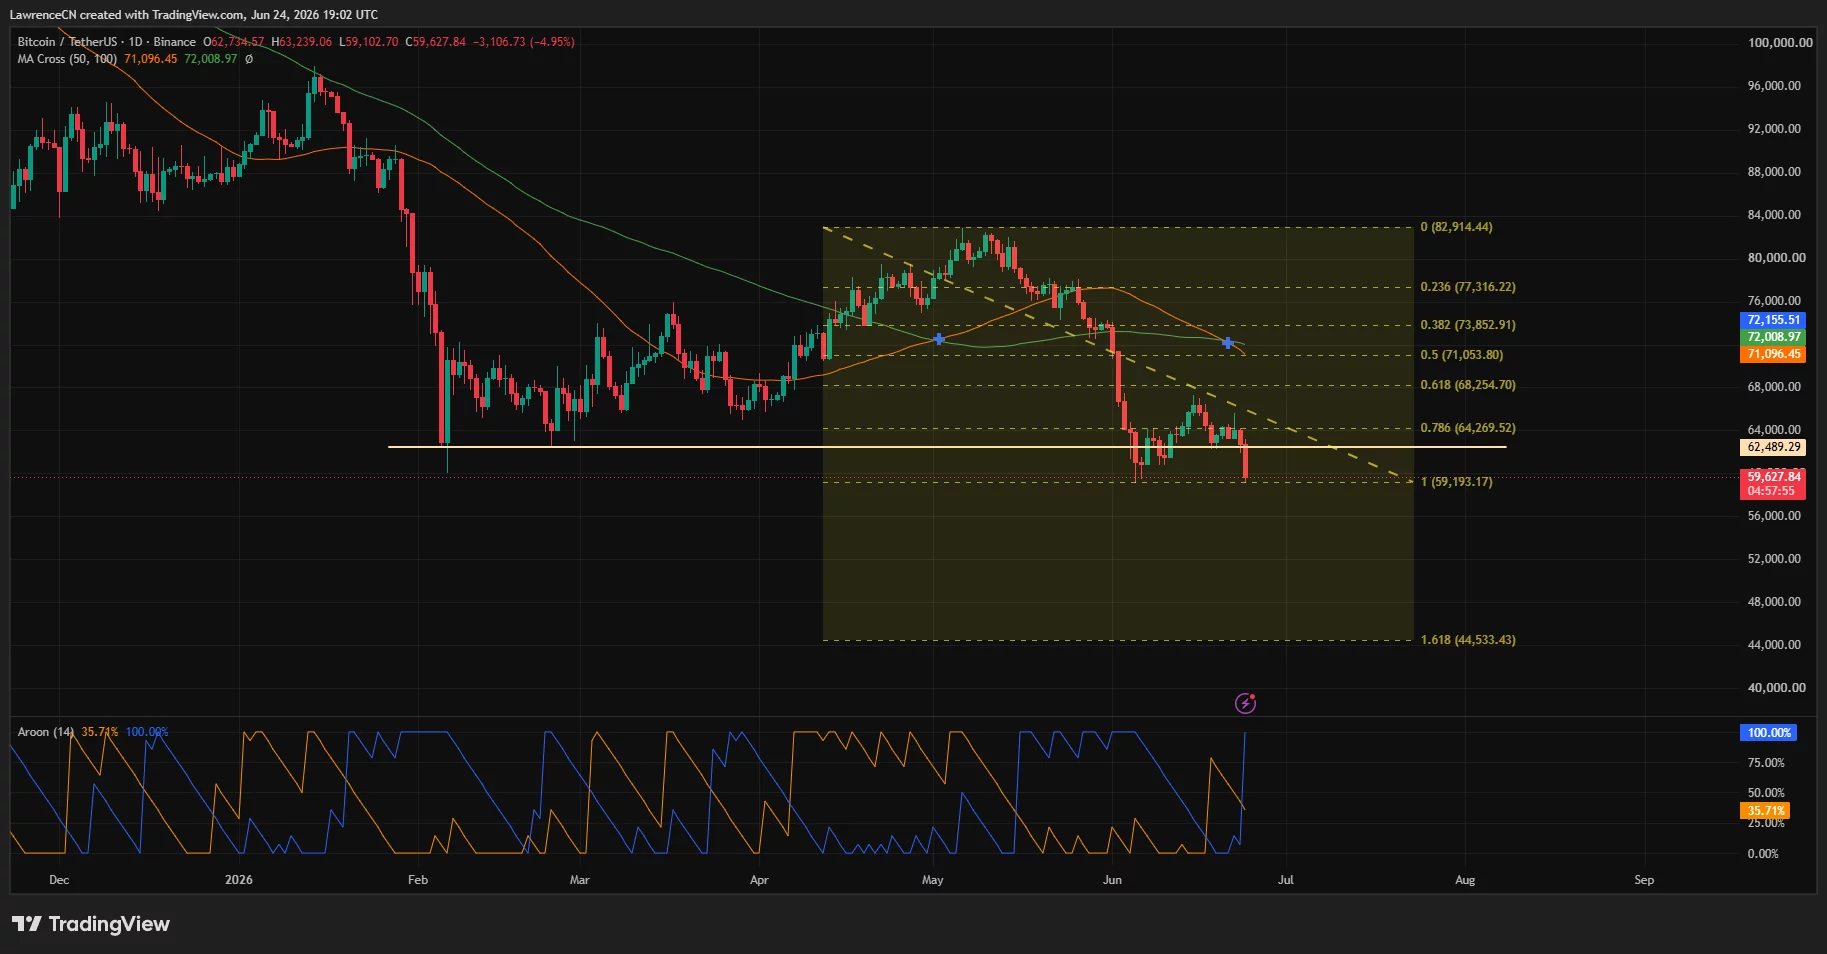
Meanwhile, Bitcoin remains trapped below the downtrend line that has capped every recovery attempt since the May high. Each bounce has resulted in a lower high, maintaining the bearish structure that has defined the market over the past several weeks.
Moving averages also continue to favor sellers. The chart shows Bitcoin trading below its 50-day moving average near $71,100 and its 100-day moving average around $72,000, with the 50-day moving average remaining below its 100-day moving average in a bearish crossover indicating weak medium-term momentum.
Previous attempts to reclaim those levels failed, allowing bearish momentum to accelerate as support areas collapsed.
$60,000 became the last line for the bulls
Attention has now turned to the $59,000-$60,000 area, which has emerged as the most important support area on the daily chart. Buyers successfully defended this area earlier in June, sparking a rebound that eventually lifted Bitcoin above $70,000 before the momentum faded.
Market indicators suggest that sellers still have the advantage. The Aroon indicator shows the Aroon Down at 100%, while the Aroon Up remains near 36%, a formation that typically indicates sustained downward pressure and continued dominance through recent lows.
Daan Crypto Trades described the 78.6% retracement as the last major support level before the $60,000 area comes under immediate pressure. The analyst added that failure to hold in this area may open the door to a breach of the June low and force traders to look for support at lower levels.
A successful defense could allow Bitcoin to attempt a recovery towards the $64,000 area, where the missing 78.6% Fibonacci level now sits as resistance. Beyond that, buyers will need to reclaim the $68,000 area and break the downtrend line before considering a broader trend reversal.
However, if support fails, the chart provides little evidence of strong demand directly below current levels. The Fibonacci forecast shows an extension at the 1,618 area near $44,500, highlighting a downtrend that traders may begin to debate whether Bitcoin has decisively lost its June floor.
With the price now directly in the support zone that previously led to a sharp rebound, the coming sessions could determine whether Bitcoin forms a permanent bottom or extends the correction that has dominated trading since May.
Disclosure: This article does not constitute investment advice. The content and materials contained on this page are for educational purposes only.


