

Chainlink price reached $9.32 on April 15, rising 1.64% in the 4-hour session, after clearing all four simple moving averages simultaneously for the first time since the February decline, with the bar pressing into the $0.14 range before the breakout and the 4-hour MACD holding a positive crossover above the zero line.
summary
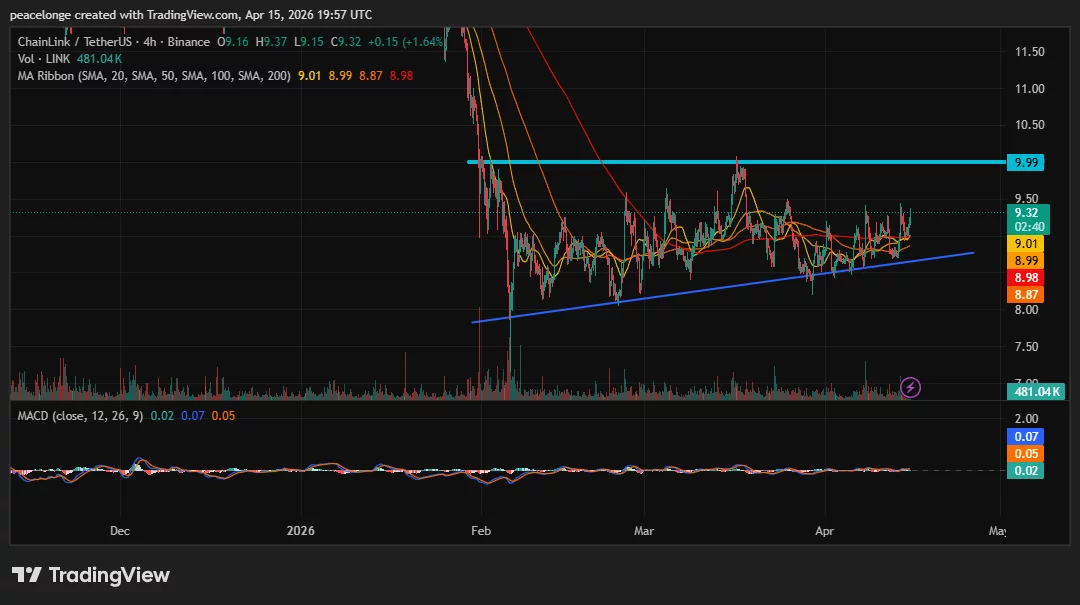
- Chainlink price reached $9.32 on April 15, +1.64% on the 4-hour chart, after breaking above the 4-level SMA compact bar, with SMA 20 at $9.01, SMA 50 at $8.99, SMA 100 at $8.87, and SMA 200 at $8.98, within a range of $0.14.
- The 4H MACD (12,26,9) printed a bullish crossover with the histogram at +0.02, the MACD line at 0.07, and the signal at 0.05, with both lines above zero, confirming momentum acceleration rather than simple exhaustion reduction.
- A four-hour close above the annotated resistance level at $9.99 confirms the breakout and opens the $10 to $11 area; A return close below the 20 SMA at $9.01 indicates a breakout failure and consolidation extends.
Chainlink (connection) price at $9.32 on April 15, up 1.64% on Binance 4-hour chart, as the price broke above the fully compressed SMA bar consisting of SMA 20 at $9.01, SMA 50 at $8.99, SMA 100 at $8.87, and SMA 200 at $8.98. The four moving averages converged in the $0.14 range before the breakout, a degree of pressure that is unusual across time frames and usually precedes a significant directional expansion. The 4-hour volume for 481.04K LINK confirms active participation in the move rather than low-volume drift above the bar.
The breakout comes as the uptrend line from the February 2026 lows continues to hold below, connecting successive higher lows via a recovery from the bottom in the near term. The price has been above this trend line throughout the current advance and the trend line has absorbed every pullback during April without a confirmed 4-hour close below it.
SMA bands are compressed when the rate of price change is equal across multiple time frames, resulting in a coil-like structure where all moving averages converge toward a single price group. The squeeze in the Chainlink 4H bar, where four SMAs are converging within $0.14 of each other, represents one of the tightest SMA combinations on record for LINK in the current session. When the price breaks above a fully compressed bar in terms of volume, as Chainlink did on April 15, the squeeze typically turns into a directional expansion in the direction of the breakout.
The 4-hour MACD (12,26,9) confirmed a bullish crossover with the MACD line at 0.07 and the signal at 0.05, both above zero. The chart at +0.02 is positive and expanding. A MACD crossover that occurs with both lines above the zero line is a stronger signal than a crossover below zero, because it reflects a true upward acceleration rather than a deceleration in selling pressure. Solana and XRP print sub-zero MACD crossovers on April 14; The Chainlink 4H crossover occurring above zero characterizes the quality of the current momentum signal.
Analysts at FXStreet noted on April 10 that Chainlink’s open interest weighted funding rate turned positive at 0.0042%, with traders building long positions as the token tested its SMA range. The positive funding ratio maintained during a period of broader market uncertainty confirms that the long bias in LINK derivatives persisted throughout the merger and in the current breakout attempt.
Key levels: support, resistance and price targets
The compact SMA range between $8.87 and $9.01 is now the support area. A four-hour close below $9.01 brings the price back inside the bar and indicates a failed breakout. A four-hour close below $8.87, the 100 SMA and the bottom of the bar, is a complete invalidation level and will bring the structure back into the range.
The highlighted horizontal resistance at $9.99 is the immediate target and a level that has capped multiple four-hour rallies since February. A confirmed 4-hour close above $9.99 clears this ceiling and opens up the $10 to $11 area as a key target for the upside. An extended move through $11 brings the $12 area into focus, where the 200-day EMA is on the daily chart.
Invalidation: 4-hour close below $8.87.
Market data context and chain
Coinglass data shows that Chainlink’s open interest stands at $361.55 million, with 24-hour futures volume at $361.51 million. The near-equal ratio of open interest to daily futures volume indicates an active position rotation Rather than a fixed exposure, which suggests that traders are actively repositioning their positions around the breakout level. Nearly $42,599 in Chainlink futures positions were liquidated in the past 24 hours, a small number that confirms that the move is not driven by a short squeeze. A breakout based on true buying rather than forced short covering historically results in a more sustainable price continuation.
Chain link Controls Nearly 64% of the Oracle market, with more than $41 billion in total value secured and a $644 million buyback program supporting long-term premium demand.
If LINK maintains a 4H close above the bar SMA range at $8.87 to $9.01 and the uptrend line holds, a test of the annotated resistance at $9.99 is the primary near-term target. A confirmed close above it opens between $10 to $11 as an extended bullish case.


