
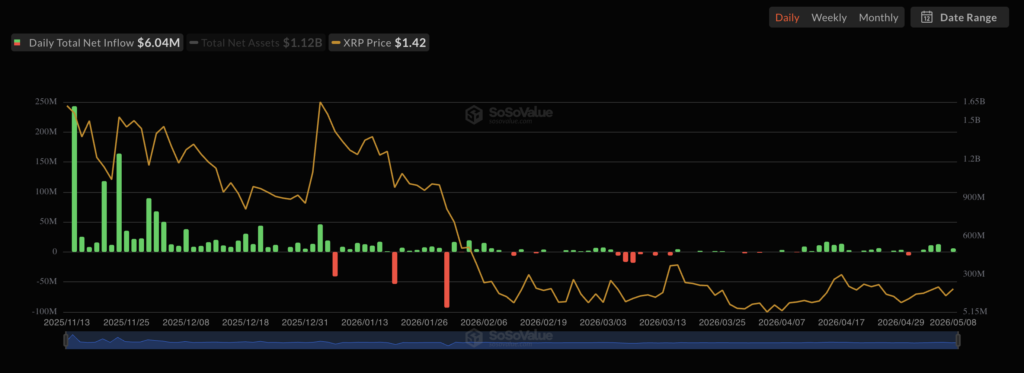
US-listed XRP exchange-traded funds (ETFs) attracted $34.21 million in net inflows in the week ending May 8, coinciding with a more than 6% rise in the spot price of XRP.
What made XRP ETFs attractive last week?
The flows came as risk assets recovered, supported by strong earnings in the United States and easing macro pressures. US stocks rose to record highs. Bitcoin ETFs attracted $623 million in the same period. Ethereum and Solana ETFs also recorded notable inflows.
SoSoValue said traders were starting to attract “high beta exposure” as risk sentiment improved.
“What matters next is whether this class rotation continues,” the on-chain data platform wrote, adding:
“If BTC inflows continue to slow while SOL and XRP continue to attract capital, the market may rotate away from the risk curve. But if BTC accelerates and ETH inflows expand beyond ETHA alone, this week could look more like a healthy sentiment reset than a real shift in style.”
A “mini altcoin season” is happening but beware
For Joao Widson, founder and CEO of on-chain data resource Alphractal, the demand for XRP is part of the “micro altcoin season,” given that some cryptocurrencies other than Bitcoin have performed exceptionally well in recent weeks. They include privacy coins like Zcash (ZEC) and Dash (DASH), as well as layer-one assets like Sui (SUI) and Toncoin (TON).
However, Widson cautioned against interpreting the recent strength of XRP and altcoins as the start of a full-fledged altcoin season. Similar rotations into higher beta assets over the past couple of years have repeatedly fizzled out before developing into sustainable trends.
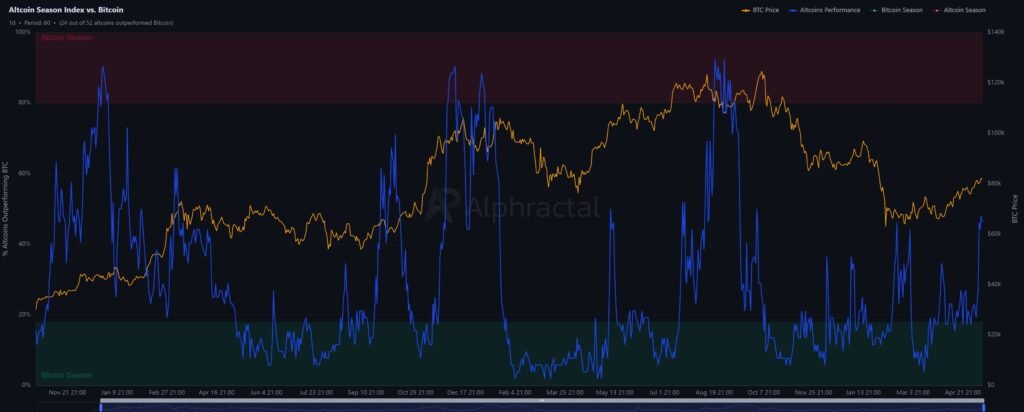
This warning is in line with Alphractal’s Altcoin Season Index, which remains below the 80% threshold typically associated with broad-based outperformance of altcoins versus Bitcoin.
XRP technicians point to a decline towards $1
The near-term technical structure of XRP shows downside risks.
On the daily chart, the token is consolidating within a symmetrical triangle after a long downtrend, which is usually considered a bearish continuation setup when formed during bearish markets.
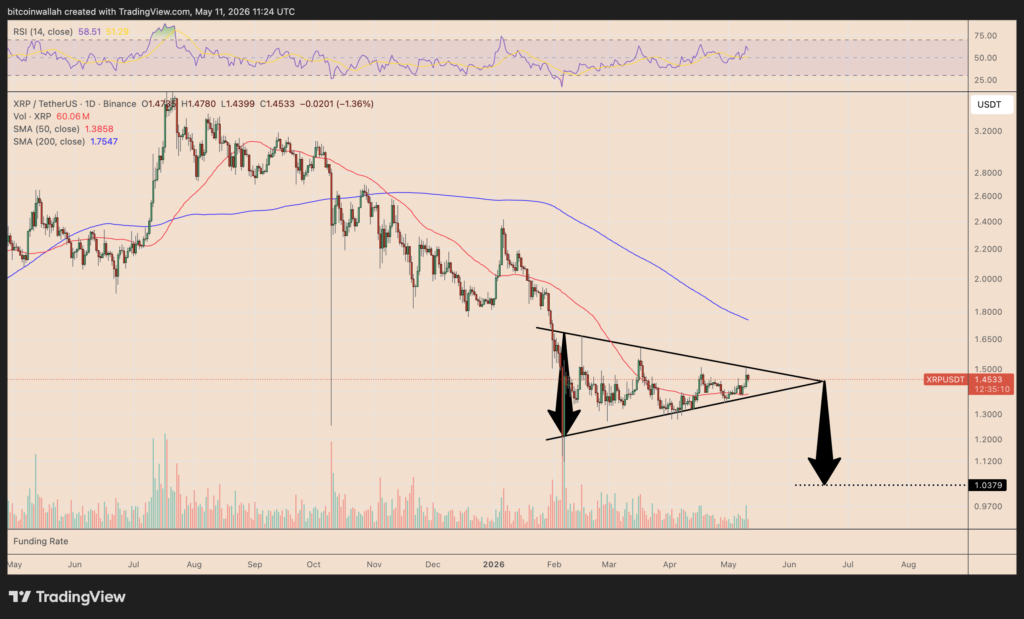
A breakout below the lower trend line of the triangle could trigger a move towards the $1 level, based on the maximum height of the pattern.
The bearish scenario risks invalidation if XRP breaks the upper trendline of the triangle at around $1.50, which would increase the likelihood of a rally towards the 200-day simple moving average (200-day SMA, in blue) near $1.75, which has capped bullish attempts throughout 2026.


