
XRP (XRP) failed to sustain gains after Ondo Finance, Ripple, JPMorgan Chase, and Mastercard completed a cross-border treasury settlement trial on the XRP Ledger this week.
High-profile partnerships fail to lift XRP prices
In a press release published On May 6, Ondo Finance said its token US Treasury fund, OUSG, was redeemed via banking networks using infrastructure connected to Ripple, JPMorgan’s Kinexys platform, and Mastercard’s Multi-Token network.
The pilot used XRPL in the asset redemption phase, which settled in less than five seconds, while the notes were settled through traditional banking routes outside normal business hours.
The announcement briefly lifted XRP by about 1% to roughly $1.42 during the day before the gains faded.
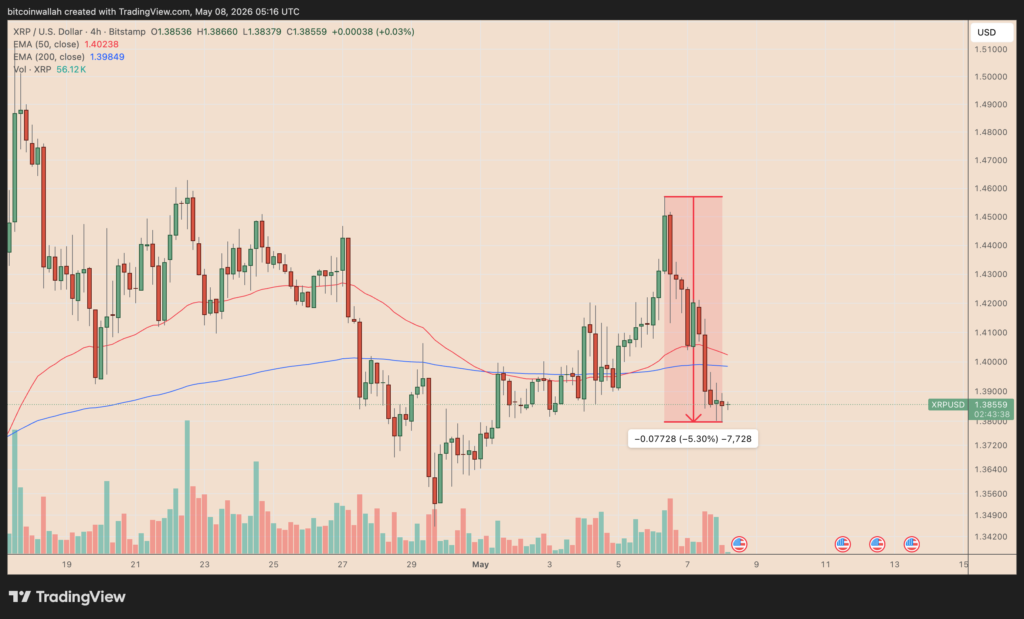
By May 8, XRP was trading near $1.38-$1.41, down about 5.3% from levels seen immediately after the announcement, amid broader cryptocurrency market consolidation.
Fears that the US-Iran ceasefire might end have exacerbated the sell-off, which is why traders have been avoiding high-profile Ripple partnerships as signals to enter the XRP market.
The muted reaction extends a familiar pattern for XRP.
Several institutional announcements related to Ripple in 2025 and 2026 failed to produce a sustainable uptrend. In February, deals involving Deutsche Bank, Aviva Investors, Zand Bank, Figment, and Société Générale coincided with Ripple (XRP) falling from around $2.42 to nearly $1.35.
Similar “sell news” moves followed XRPL-related updates involving Société Générale’s EURCV stablecoin, SBI token bonds, and Deutsche Bank’s Ripple payment integration.
XRP Price Analysis:
Technically, XRP is consolidating inside a falling wedge pattern after failing to reclaim resistance near the 50-day EMA (50-day EMA, red wave) and the 0.236 Fibonacci level around $1.44.
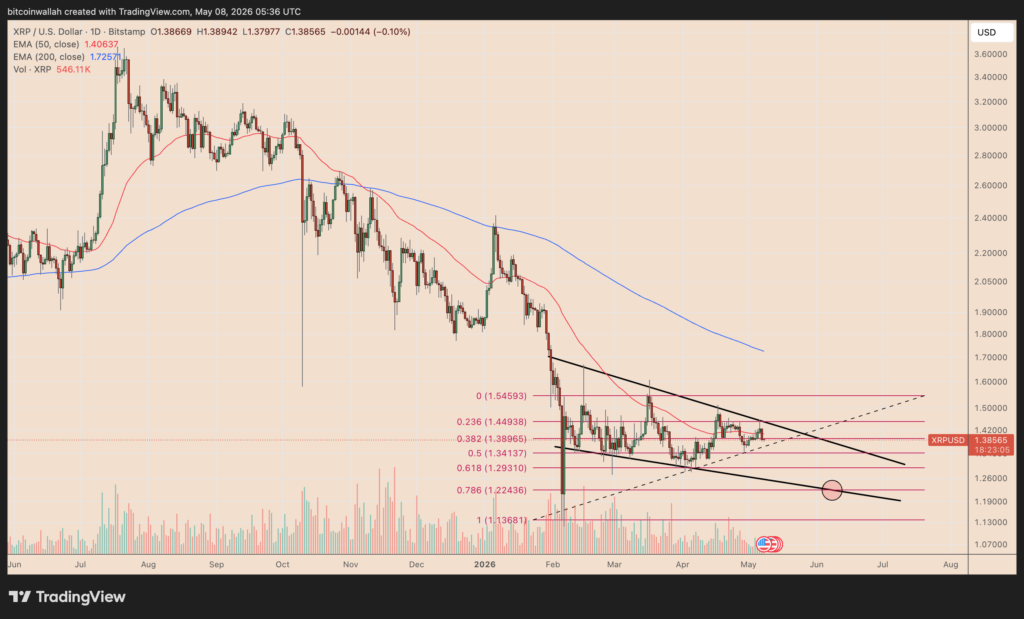
A breakdown below the upper support group of the wedge risks sending the price towards the lower trend line near $1.22, which is in line with the 0.786 Fibonacci retracement level.
However, falling wedge patterns usually lead to a breakout, keeping the odds of XRP rising in the coming months higher. A clear break above the upper trend line will likely push the price as high as the maximum height of the wedge.
If the price decisively breaks above the upper trend line of the wedge near current levels, the pattern’s measured move setup indicates an upside target near the 200-day moving average at around $1.67-$1.72.
Before then, XRP may test temporary resistance near the 0.0 Fibonacci retracement level around $1.54, which is closely aligned with the breakout path marked on the chart.


