
XRP has been trapped in a triangle range for months, but its largest holders are still betting on a breakout.
Whales’ XRP holdings have reached an 8-year high
Wallets holding at least 10 million XRP now control about 45.83 billion coins, or roughly 68.5% of the token supply, representing their largest combined balance since May 2018, according to Santiment data.
The increase indicates that the largest holders of XRP continued to accumulate during the token’s consolidation phase. This may also indicate that smaller large wallet pools, which previously held less than 10 million XRP, have added enough tokens to move into the whale category.
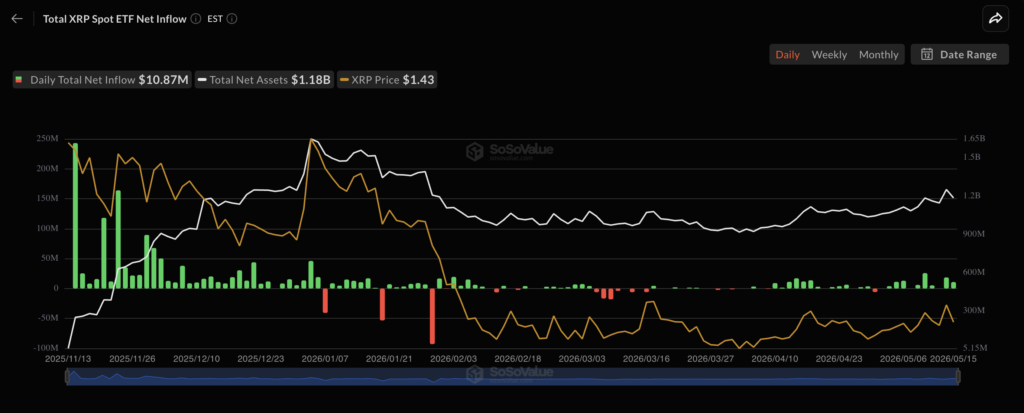
These whales may include addresses linked to XRP exchange-traded funds (ETFs). As of May 18, these investment vehicles collectively had $59.25 million in assets under management, equivalent to about 42.32 million XRP, according to data resource SoSoValue.
If whales absorb liquid supply from exchanges and weaker hands, fewer coins may be available to buyers once momentum returns. In that environment, even a moderate rebound in spot demand, ETF flows, or broader risk appetite in altcoins could trigger a sharper move than price action currently indicates.
Crypto Patel sees XRP rising towards $15
The whale accumulation trend is consistent with the long-term bullish setup shared by market analyst Crypto Patel, who He argues That XRP may be approaching the final stage of its current accumulation phase.
Patel’s chart highlights the $1.00 to $0.70 range as a key demand area, describing it as a potential long-term accumulation area ahead of XRP’s next major expansion. Its upside targets are at $5, $10, and $15, meaning a potential 10x-15x move from the lower end of this range if XRP repeats the behavior of the previous cycle.
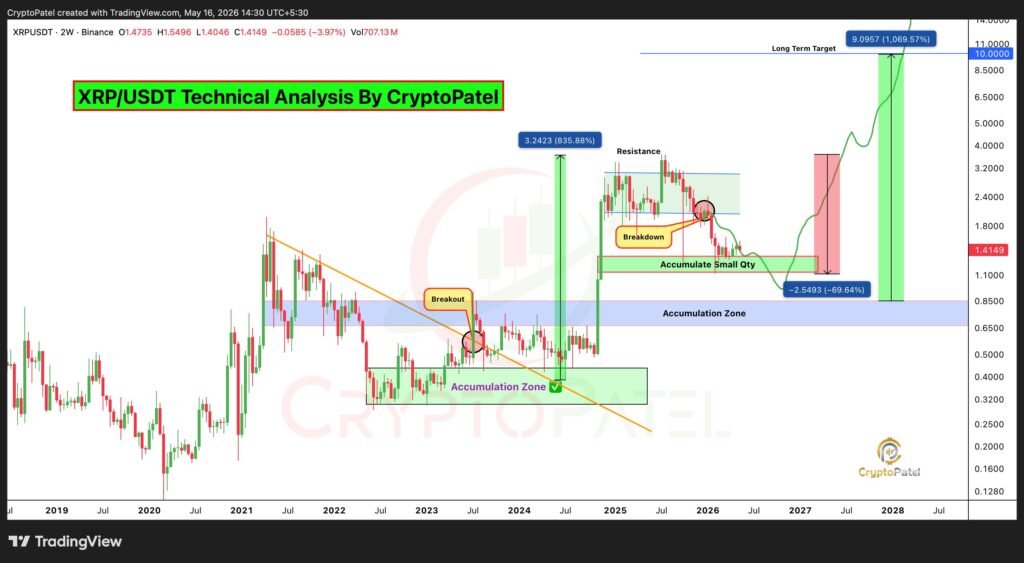
The comparison is based on the structure of XRP for the period 2022-2024. During that period, the token spent months building a base between $0.32 and $0.40, then broke above the multi-year downtrend line near $0.55 and $0.60 in November 2024. This breakout also cleared the broader resistance area between $0.65 and $0.85, triggering a sharp rally afterward.
Patel says a similar breakout of XRP’s current triangle range could open the door to another significant upward move. However, the bullish scenario depends on XRP defending its accumulation zone and breaking through resistance with stronger volume.
However, the negative pressure on XRP continues
The bullish outlook emerged as XRP felt pressure from broader risk-off sentiment.
The token tied to Ripple has fallen more than 11% from its April high, as a bond market rally has exhausted appetite for risky assets. Persistent inflation caused by the ongoing oil crisis was the main catalyst behind this decline. These overall pressures may continue as long as the conflict between the United States and Iran continues.
From a technical perspective, the weekly chart of XRP shows price compression within a symmetrical triangle, a pattern where lower highs and higher lows are pressuring the market into a narrower range. For starters, this means that buyers and sellers are fighting for control, but neither side has won yet.
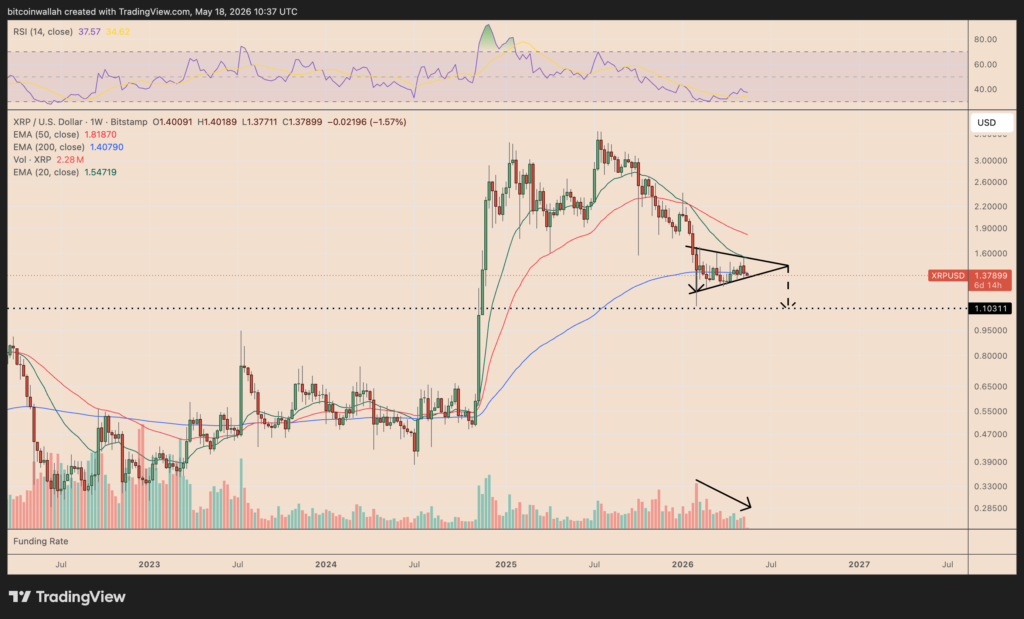
The risk is that XRP breaks below the lower trend line of the triangle near $1.30-$1.35. Such a move would indicate that sellers have taken control, especially since trading volume has begun to fade during the consolidation process.
A confirmed breakout could send XRP towards the next major support near $1.10, which is the expected downside target of the triangle.


