

XRP price reached $1.4311 on April 20, with the 4-hour chart showing a symmetrical triangle peaking simultaneously with a bearish MACD crossover, pressuring an impending trend resolution at the pattern’s narrowest point.
summary
- XRP price reached $1.4311 on April 20, down 0.13% during the 4-hour session, with a symmetrical triangle on the 4-hour chart peaking between the upper trend line falling from the February highs and the lower trend line rising from the March lows.
- The 4-hour MACD (12,26,9) has printed a bearish crossover with the histogram at -0.0032, and the MACD line at 0.0021 is crossing below the signal at 0.0052, adding near-term bearish momentum pressure as the triangle forces an impending decision.
- A confirmed four-hour close above the 20 simple moving average at $1.4373 and the upper triangle trend line opens at $1.50 as a primary target; A four-hour close below the lower trend line near $1.37 exposes $1.30 as the next structural support.
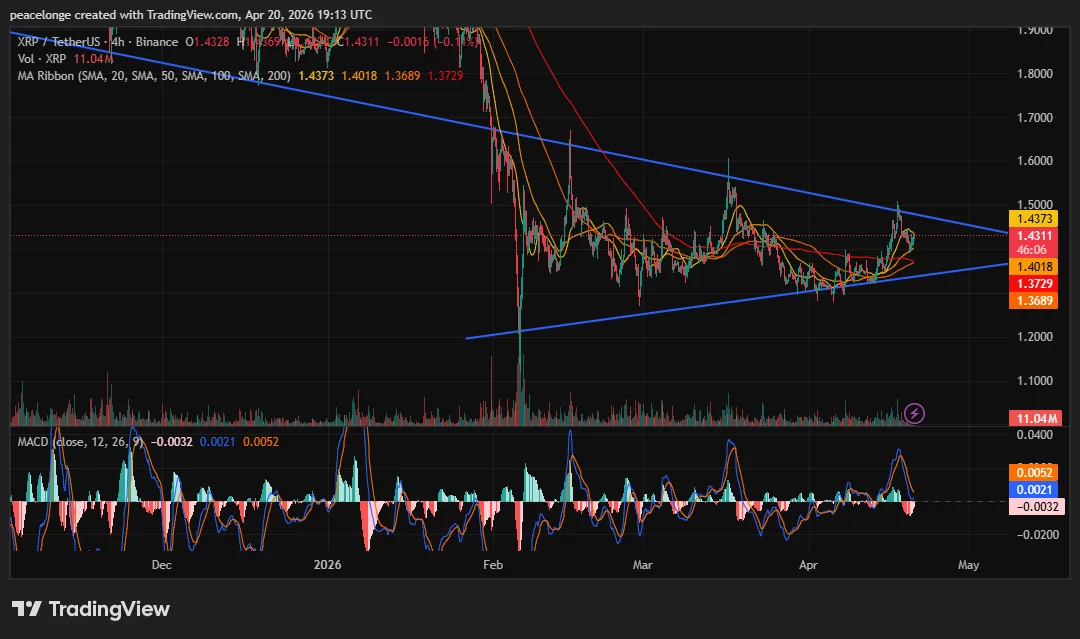
ripple (XRP) The price was at $1.4311 on Apr 20, down 0.13% in the 4-hour session, as a symmetrical triangle on the 4-hour chart squeezes the price between a bearish upper trend line from the February highs above $1.90 and a bearish upper trend line from the March lows around $1.20. The pattern has reached its peak, and a directional decision is now imminent. The 4-hour MACD printed a bearish crossover at the same time, with the histogram at -0.0032, adding a momentum signal in line with the bearish upper trend line acting as overhead resistance. The MA bar is partially bullish: SMA 50 at $1.4018, SMA 100 at $1.3689, and SMA 200 at $1.3729 are all below the current price, but SMA 20 at $1.4373 remains slightly above the price and acts as first resistance on a 4-hour closing basis.
A 4-hour symmetrical triangle has been forming since the February peak at around $1.90, with the upper descending trend line connecting successive lower highs and the lower ascending trend line connecting successive higher lows from the March cycle lows. Trading volume has declined throughout the squeeze phase, which is consistent with the typical symmetrical triangle structure and indicates that volatility expansion is approaching as the top closes.
The 4-hour symmetrical triangle outlines the current price structure of XRP over the period from December 2025 to April 2026, with the converging trend lines now converging at the current price level. The 4H MACD (12,26,9) produced a bearish crossover inside the triangle at the apex, with the MACD line crossing at 0.0021 below the signal at 0.0052 and the histogram at -0.0032. Both lines remain above zero, limiting the intensity of the bearish signal relative to the crossover below zero, but the trend turn at the top of the triangle and upper 20 SMA resistance is the most relevant near-term momentum reading.
The 20 simple moving average at $1.4373 is the key technical level that lies just above the price. Until XRP closes the 4-hour candle above it alongside the upper triangle trend line, a bearish crossover is the effective 4-hour signal. precedent analysis Published on April 15 on crypto.news, it identified $1.50 as the primary target for a breakout of the symmetrical XRP triangle, with the pattern’s measured movement indicated from the widest point of the triangle toward that level. The technical convention states that symmetrical triangles are resolved with a move equal to the height of the widest part of the pattern from the breakout point, and the widest part of the triangle is currently around $0.25, putting the full measured target near $1.68 on upside resolution from the $1.43 high.
Key levels: support, resistance and price targets
The 20 simple moving average at $1.4373 is the first resistance level above the current price. A four-hour close above it, combined with a close above the upper downtrend line, confirms the symmetrical triangle breakout and opens $1.50 as an immediate target. A sustained move above $1.50 makes the 100 SMA at $1.5625 emerge as the next important resistance in an extended bullish case.
On the downside, the lower uptrend line is currently located near $1.37 to $1.38 on the 4-hour chart. A confirmed four-hour close below the lower trend line breaks the symmetrical triangle structure and shifts the bias decisively lower, exposing $1.30 as the next structural support. The lower trend line is in line with the 1.0 Fibonacci retracement level identified in the previous daily chart analysis as the main floor below the current pattern. Below $1.30, $1.20 represents the last major demand area before the uncharted territory of the current correction.
Bullish case invalidated: 4-hour close below $1.37.
Market data context and chain
XRP Perpetual Futures Open interest It stands at approximately $2.48 billion per Coinglass, down sharply from the more than $9 billion recorded in early October 2025. The significant reduction in speculative positions over the past six months reduces the risk of a cascading liquidation event on either a breakout or breakdown from the current triangle top, creating a cleaner technical setup than the crowded positions of the previous quarter. The 4-hour volume of 11.04 million XRP in the current session is in line with recent sessions, confirming the absence of a strong conviction breakout or distribution event at the top.
XRP ETF inflows reached $17 million in the week of April 14, the strongest weekly inflow since early February, providing structural demand headwinds that conflict with the 4-hour MACD bearish crossover signal. The divergence between improving institutional demand and deteriorating 4-hour momentum at the top of the triangle is the main tension driving the current directional uncertainty.
If XRP closes the 4-hour candle above the 20 SMA at $1.4373 and the upper triangle trend line with increasing volume, $1.50 is the primary near-term target with $1.5625 as an extension target. A four-hour close below the lower triangle border near $1.37 triggers a bearish decision to top with $1.30 as an immediate downside target.


